PINE LIBRARY
Atualizado RationalQuadraticKernelFunction
Description:
An optimised library for non-repainting Rational Quadratic Kernel Library. Added lookbackperiod and a validation to prevent division by zero.
Thanks to original author jdehorty.
Usage:
1. Import the library into your Pine Script code using the library function.
Pine Script®
2. Call the Main Function:
Use the rationalQuadraticKernel function to calculate the Rational Quadratic Kernel estimate.
Provide the following parameters:
3. Plot the Estimate:
Plot the resulting estimate on your TradingView chart using the plot function.
Pine Script®
Parameter Explanation:
Example Usage:
Here's an example of how to use the library to calculate and plot the Rational Quadratic Kernel estimate for the 'close' price series:
Pine Script®
This example calculates the estimate for the 'close' price series, considers the previous 11 bars, assigns equal weight to all data points, and starts the calculation from the 24th bar. The result is plotted as an orange line on the chart.
Highly recommend to customize the parameters to suit your analysis needs and adapt the library to your trading strategies.
An optimised library for non-repainting Rational Quadratic Kernel Library. Added lookbackperiod and a validation to prevent division by zero.
Thanks to original author jdehorty.
Usage:
1. Import the library into your Pine Script code using the library function.
import vinayakavajiraya/RationalQuadraticKernelFunction/1
2. Call the Main Function:
Use the rationalQuadraticKernel function to calculate the Rational Quadratic Kernel estimate.
Provide the following parameters:
- `_src` (series float): The input series of float values, typically representing price data.
- `_lookback` (simple int): The lookback period for the kernel calculation (an integer).
- `_relativeWeight` (simple float): The relative weight factor for the kernel (a float).
- `startAtBar` (simple int): The bar index to start the calculation from (an integer).
- rationalQuadraticEstimate = rationalQuadraticKernel(_src, _lookback, _relativeWeight, startAtBar)
3. Plot the Estimate:
Plot the resulting estimate on your TradingView chart using the plot function.
plot(rationalQuadraticEstimate, color = color.red, title = "Rational Quadratic Kernel Estimate")
Parameter Explanation:
- `_src`: The input series of price data, such as 'close' or any other relevant data.
- `_lookback`: The number of previous bars to consider when calculating the estimate. Higher values capture longer-term trends.
- `_relativeWeight`: A factor that controls the importance of each data point in the calculation. A higher value emphasizes recent data.
- `startAtBar`: The bar index from which the calculation begins.
Example Usage:
Here's an example of how to use the library to calculate and plot the Rational Quadratic Kernel estimate for the 'close' price series:
//@version=5
library("RationalQuadraticKernelFunctions", true)
rationalQuadraticEstimate = rationalQuadraticKernel(close, 11, 1, 24)
plot(rationalQuadraticEstimate, color = color.orange, title = "Rational Quadratic Kernel Estimate")
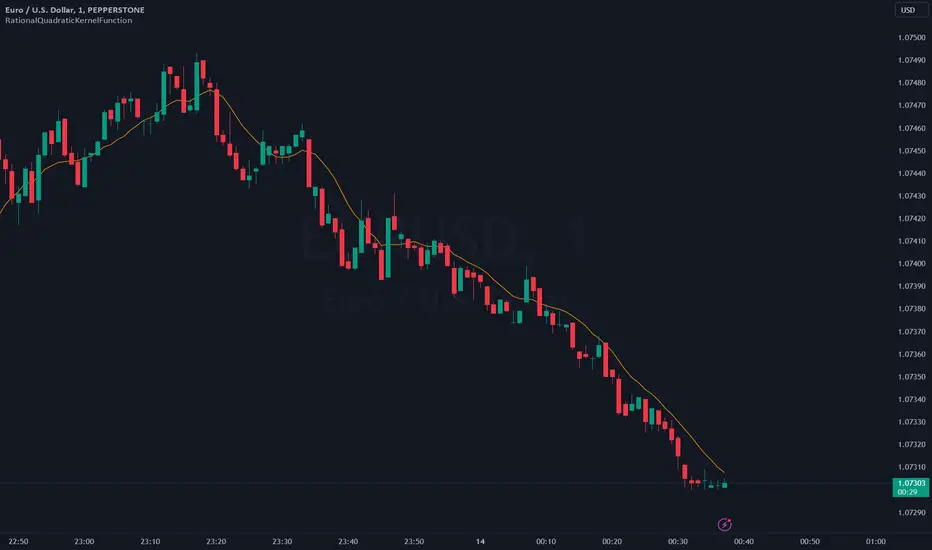
This example calculates the estimate for the 'close' price series, considers the previous 11 bars, assigns equal weight to all data points, and starts the calculation from the 24th bar. The result is plotted as an orange line on the chart.
Highly recommend to customize the parameters to suit your analysis needs and adapt the library to your trading strategies.
Notas de Lançamento
v2Change log:
- Removed Starting window
- The size is determined based on a user-defined value, providing greater flexibility in managing the data for the bars, with the possibility of exceeding the value 2000 if necessary.
removed few variables
rationalQuadraticKernel(src, lookback, relativeWeight)
Parameters:
src (float)
lookback (simple int)
relativeWeight (simple float)
Notas de Lançamento
v3Change log:
- Removed default plot (to avoid during importing into indicator)
- Updated an example with full implementation of library.
Example:
// @version=5
indicator(title="Relational Quadratic Kernel Estimate , shorttitle="RQKE-V", overlay=true, timeframe = "", timeframe_gaps = false)
// Import (latest) external library
import vinayakavajiraya/RationalQuadraticKernelFunction/2 as kernel
// Input parameters for the kernel estimate
length = input.int(title="Lookback Window", defval=10, minval=1, step=1, group="Kernel Estimate", tooltip="The number of previous bars to consider when calculating the rationalQuadraticEstimate. Higher values capture longer-term trends.")
relativeWeight = input.float(title="Relative Weight", defval=8, minval=1, step=1, group="Kernel Estimate", tooltip="A factor that controls the importance of each data point in the calculation. A higher value emphasizes recent data.")
source = input.source(title="Source", defval=close, group="Kernel Estimate"), // Data source (e.g., close price) for the calculation
// Calculate the rational quadratic estimate using the imported library
rationalQuadraticEstimate = kernel.rationalQuadraticKernel(
source, // Data source for calculation
length, // Lookback window
relativeWeight // Relative weight of data points
)
// Plot the rational quadratic estimate on the chart
plot(rationalQuadraticEstimate, color=color.orange, title="Relational Quadratic Estimate")
Biblioteca do Pine
Em verdadeiro espírito TradingView, o autor publicou este código Pine como uma biblioteca de código aberto para que outros programadores Pine da nossa comunidade possam reutilizá-lo. Parabéns ao autor! Você pode usar esta biblioteca de forma privada ou em outras publicações de código aberto, mas a reutilização deste código em publicações é regida pelas Regras da Casa.
Aviso legal
As informações e publicações não se destinam a ser, e não constituem, conselhos ou recomendações financeiras, de investimento, comerciais ou de outro tipo fornecidos ou endossados pela TradingView. Leia mais nos Termos de Uso.