OPEN-SOURCE SCRIPT
Atualizado WLI Swing High/Low advnc indicator

for Class members
else
label.set_xy(lowMsg, bar_index, close)
label.set_text(lowMsg, "making New Low")
label.set_color(lowMsg, newSwingLowColor)
label.set_textcolor(lowMsg, color.white)
else
if not na(lowMsg)
label.delete(lowMsg)
lowMsg := na
else
label.set_xy(lowMsg, bar_index, close)
label.set_text(lowMsg, "making New Low")
label.set_color(lowMsg, newSwingLowColor)
label.set_textcolor(lowMsg, color.white)
else
if not na(lowMsg)
label.delete(lowMsg)
lowMsg := na
Notas de Lançamento
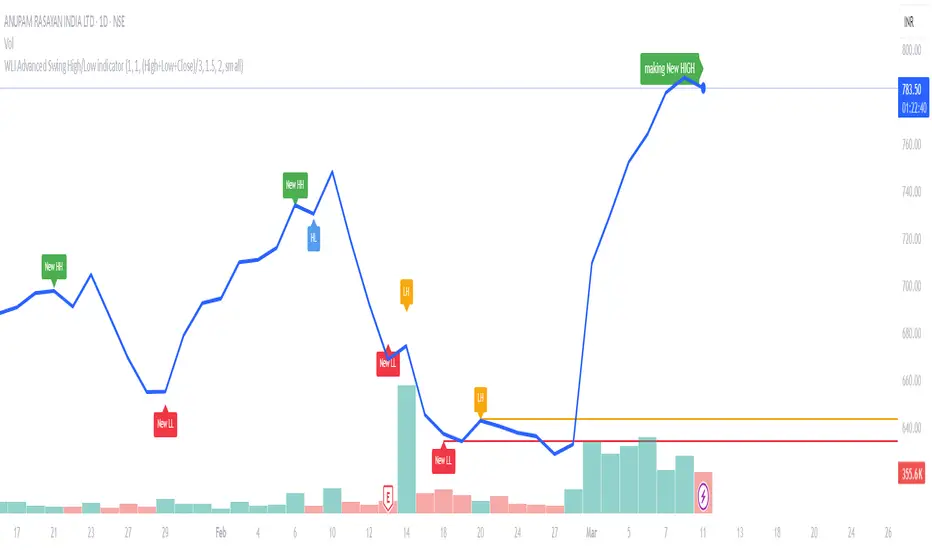
1. OverviewThis indicator identifies swing highs and lows on your chart and filters out minor price fluctuations by using a minimum percentage change. It also allows you to choose how the pivots are calculated:
- Close
- High & Low
- (High+Low+Close)/3
By showing clear labels and lines for each pivot, plus optional messages like “making New HIGH” or “making New Low,” this tool helps you see important turning points in price action more easily.
2. Key Features
- Pivot Calculation Basis:
- Close: Uses only closing prices to detect pivots.
- High & Low: Uses the bar’s high for swing highs and low for swing lows.
- (High+Low+Close)/3: Uses the average of the bar’s high, low, and close (also called the “typical price”).
- Minimum % Change Filter:
- You can set a threshold (e.g., 3%) to ignore smaller moves that might cause whipsaws.
- The script will only confirm a new pivot if the price has moved beyond this threshold from the last pivot.
- Swing Labels:
- Marks each pivot high as either a “New HH” (New Higher High) or “LH” (Lower High).
- Marks each pivot low as either a “New LL” (New Lower Low) or “HL” (Higher Low).
- Places color-coded labels above swing highs and below swing lows for easy identification.
- Breakout Messages:
- Displays “making New HIGH” if the current bar’s chosen price source crosses above the last swing high.
- Displays “making New Low” if the current bar’s chosen price source drops below the last swing low.
- Customizable Style & Parameters:
- Adjust pivot detection (Left Pivot Bars, Right Pivot Bars).
- Change colors for new and regular swing highs/lows.
- Modify line widths and label sizes.
- Works across multiple time frames.
3. How to Use
1. Add the Indicator:
Copy the Pine Script code into TradingView’s Pine Editor.
Click “Add to Chart” to load the indicator onto your current chart.
2. Choose Pivot Basis:
- In the settings, select how you want to calculate pivots:
- Close (end-of-bar price),
- High & Low (the bar extremes),
- (High+Low+Close)/3 (typical price).
- This choice affects both pivot detection and the price used for “making New HIGH/Low” messages.
3. Set Minimum % Change:
- Decide the threshold to filter out smaller moves (e.g., 3%).
- A larger threshold filters more whipsaws; a smaller threshold captures more swings.
4. Customize Appearance:
- Adjust colors, line widths, and label size to match your chart style.
5. Interpret the Signals:
- “New HH” or “New LL” indicates a significant breakout from the last pivot.
- “LH” or “HL” indicates a lower high or higher low compared to the previous pivot.
- “making New HIGH” / “making New Low” messages show potential continuation or trend shifts when price crosses the latest swing point.
4. Why This Indicator Helps
- Trend Identification: Easily see when the market makes new highs or lows, which often signals trend continuation or reversal.
- Noise Reduction: The minimum % filter helps you ignore minor fluctuations and focus on more meaningful price action.
- Multiple Time Frames: Use it on daily, weekly, or intraday charts to spot significant pivot points at any scale.
- Visual Clarity: Color-coded labels and lines highlight critical levels, saving time and reducing guesswork.
Script de código aberto
Em verdadeiro espírito do TradingView, o criador deste script o tornou de código aberto, para que os traders possam revisar e verificar sua funcionalidade. Parabéns ao autor! Embora você possa usá-lo gratuitamente, lembre-se de que a republicação do código está sujeita às nossas Regras da Casa.
Sujit Kumar Bala
We Learn Investing
We Learn Investing
Aviso legal
As informações e publicações não se destinam a ser, e não constituem, conselhos ou recomendações financeiras, de investimento, comerciais ou de outro tipo fornecidos ou endossados pela TradingView. Leia mais nos Termos de Uso.