PINE LIBRARY
Atualizado CommonMarkup
Library "CommonMarkup"
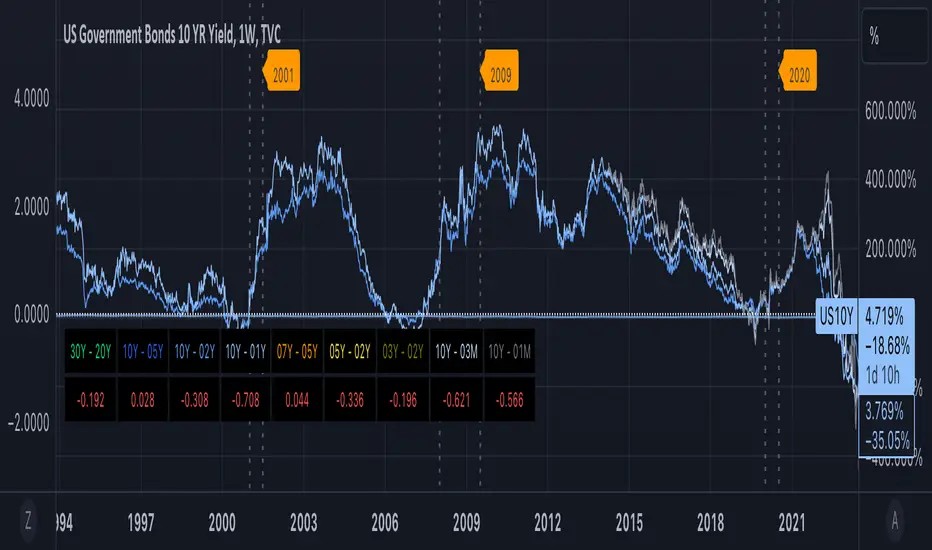
Provides functions for chart markup, such as indicating recession bands.
markRecessionBands(showBands, lineY, labelY)
Mark vertical bands and show recession band labels if argument showBands is true. Example "markRecessionBands(bar_index[0],3.0"
Parameters:
showBands: - show vertical recession bands when true. Functionally equiv to no op when false
lineY: - y-axis value for line positioning
labelY: - y-axis value for label positioning
return true - always answers the value of showBands
Notas de Lançamento
Common markup lib v2. Changes as follows:- Added 2022 contraction over Q1 to Q2
- Updated time refs to be UTC+0
Notas de Lançamento
Minor cosmetic rendering updatesNotas de Lançamento
v4 - minor display and formatting updates for readabilityNotas de Lançamento
v5Added control parameter for defining if 2 consecutive quarters of negative GDP is considered a recession
Updated:
markRecessionBands(showBands, twoQrtsOfNegativeGDPIsRecession, lineY, labelY)
Mark vertical bands and show recession band labels if argument showBands is true. Example "markRecessionBands(bar_index[0],3.0"
Parameters:
showBands: - show vertical recession bands when true. Functionally equiv to no op when false
twoQrtsOfNegativeGDPIsRecession: - if true, then periods with two consecutive quarters of negative GDP is considered a recession. Defaut is false.
lineY: - y-axis value for line positioning
labelY: - y-axis value for label positioning
return true - always answers the value of showBands
Notas de Lançamento
v6Updated:
markRecessionBands(showBands, twoQrtsOfNegativeGDPIsRecession, labelY)
Mark vertical bands and show recession band labels if argument showBands is true. Example "markRecessionBands(bar_index[0],false3.0)"
Parameters:
showBands (bool): - show vertical recession bands when true. Functionally equiv to no op when false
twoQrtsOfNegativeGDPIsRecession (bool): - if true, then periods with two consecutive quarters of negative GDP are considered a recession. Defaut is false.
labelY (float): - y-axis value for label positioning
return true - always answers the value of showBands
Notas de Lançamento
v7Updated:
- Resolved issue with private function for drawing recession bands scaling the y-axis excessively
Biblioteca do Pine
Em verdadeiro espírito TradingView, o autor publicou este código Pine como uma biblioteca de código aberto para que outros programadores Pine da nossa comunidade possam reutilizá-lo. Parabéns ao autor! Você pode usar esta biblioteca de forma privada ou em outras publicações de código aberto, mas a reutilização deste código em publicações é regida pelas Regras da Casa.
Aviso legal
As informações e publicações não se destinam a ser, e não constituem, conselhos ou recomendações financeiras, de investimento, comerciais ou de outro tipo fornecidos ou endossados pela TradingView. Leia mais nos Termos de Uso.