OPEN-SOURCE SCRIPT
Atualizado Earnings X-Ray
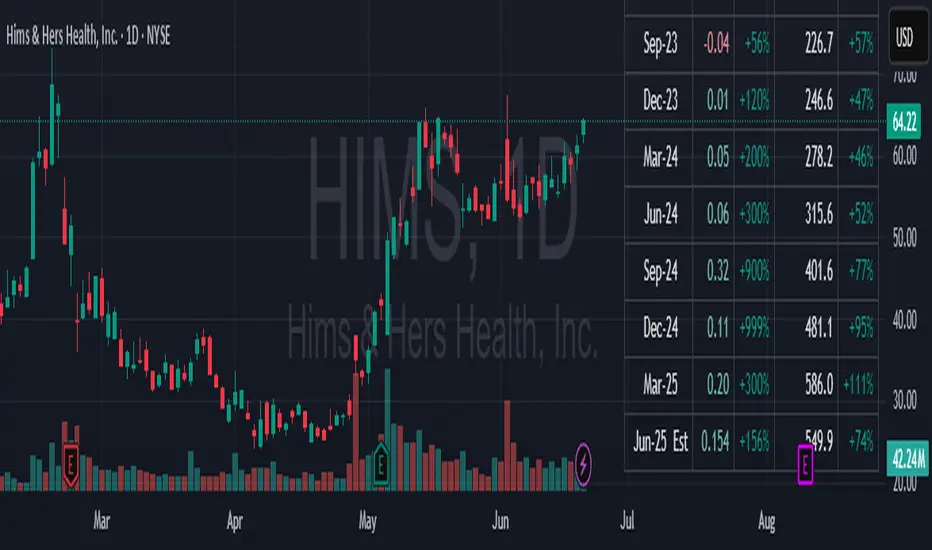
The script presents earnings and revenues in a tabular format. Particularly, it calculates percentage changes.
Earnings data can be found in TradingView Financials. However, percentage changes are not provided. Can TradingView implement this in the future?
Displaying earnings table on the chart has its benefits. No additional clicks required to access the data. This significantly streamlines the stock scanning process.
It is important to quickly evaluate a company's earnings when scanning for stocks. The script provides this capability.
Similar scripts have been created previously. This script corrects calculations and improves presentation with the concise code.
Data access:
Earnings = request.earnings(syminfo.tickerid, earnings.actual)
FutureEarnings = earnings.future_eps
FutureRevenue = earnings.future_revenue
Can more than one quarter of future earnings estimates become available in Pine Script in the future?
The script was validated against MarketSurge.
Features:
- Quarterly or Yearly data
- Configurable number of fiscal periods
- Configurable location on the chart
- Optional Dark mode
Notas de Lançamento
Bug fixes. Dark mode is now automatic. Optional color the for EPS column.Notas de Lançamento
Converted to Pine Script v6.Added Transparency setting.
Handled edge case for missing revenue value just after earnings release.
Notas de Lançamento
Minor bug fix.Notas de Lançamento
Update the chartScript de código aberto
Em verdadeiro espírito do TradingView, o criador deste script o tornou de código aberto, para que os traders possam revisar e verificar sua funcionalidade. Parabéns ao autor! Embora você possa usá-lo gratuitamente, lembre-se de que a republicação do código está sujeita às nossas Regras da Casa.
Aviso legal
As informações e publicações não se destinam a ser, e não constituem, conselhos ou recomendações financeiras, de investimento, comerciais ou de outro tipo fornecidos ou endossados pela TradingView. Leia mais nos Termos de Uso.
Script de código aberto
Em verdadeiro espírito do TradingView, o criador deste script o tornou de código aberto, para que os traders possam revisar e verificar sua funcionalidade. Parabéns ao autor! Embora você possa usá-lo gratuitamente, lembre-se de que a republicação do código está sujeita às nossas Regras da Casa.
Aviso legal
As informações e publicações não se destinam a ser, e não constituem, conselhos ou recomendações financeiras, de investimento, comerciais ou de outro tipo fornecidos ou endossados pela TradingView. Leia mais nos Termos de Uso.