ADX histogram with SMA
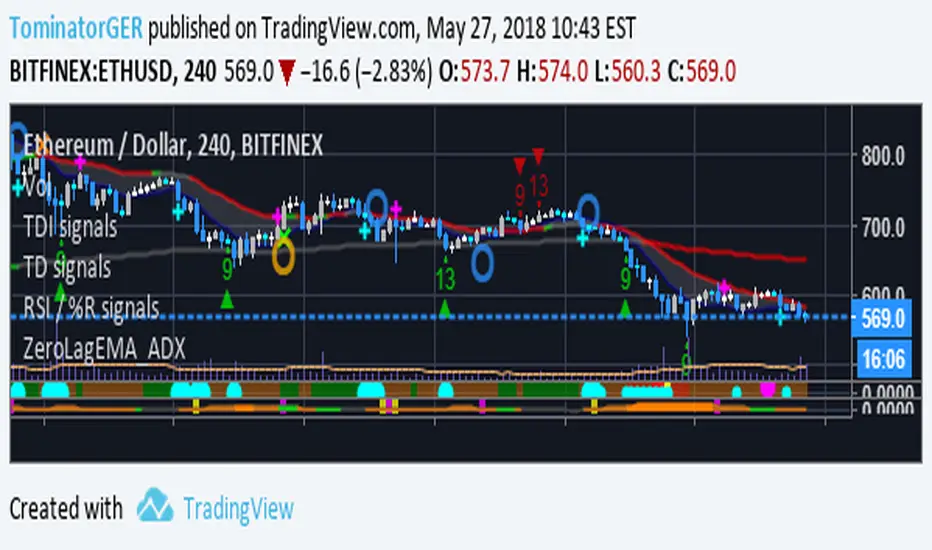
- Background gray => ADX under configured lower level which means no trend is present
- Background dark orange => ADX between lower and upper level and down trend is present
- Background orange => ADX between over upper level and down trend is overheated
- Background dark green => ADX between lower and upper level and up trend is present
- Background lime => ADX between over upper level and up trend is overheated
Additionally i have added a SMA of the ADX. The crossings of both are shown with a background color:
- yellow => ADX crossed SMA line upward which is the case with rising trend
- fuchsia => ADX crossed SMA line downward which is the case with falling trend
The indicator is optimated for small browser windows or multiple chart layouts where you have not much space left for your indicators but you also want to read the indicator signals.
For access please leave a comment.
Please provide feedback.
Script sob convite
Somente usuários aprovados pelo autor podem acessar este script. Você precisará solicitar e obter permissão para usá-lo. Normalmente, essa permissão é concedida após o pagamento. Para obter mais detalhes, siga as instruções do autor abaixo ou entre em contato diretamente com TominatorGER.
A TradingView NÃO recomenda pagar ou usar um script, a menos que você confie totalmente em seu autor e entenda como ele funciona. Você também pode encontrar alternativas gratuitas e de código aberto em nossos scripts da comunidade.
Instruções do autor
Aviso legal
Script sob convite
Somente usuários aprovados pelo autor podem acessar este script. Você precisará solicitar e obter permissão para usá-lo. Normalmente, essa permissão é concedida após o pagamento. Para obter mais detalhes, siga as instruções do autor abaixo ou entre em contato diretamente com TominatorGER.
A TradingView NÃO recomenda pagar ou usar um script, a menos que você confie totalmente em seu autor e entenda como ele funciona. Você também pode encontrar alternativas gratuitas e de código aberto em nossos scripts da comunidade.