OPEN-SOURCE SCRIPT
Atualizado Dynamic Candle Strength
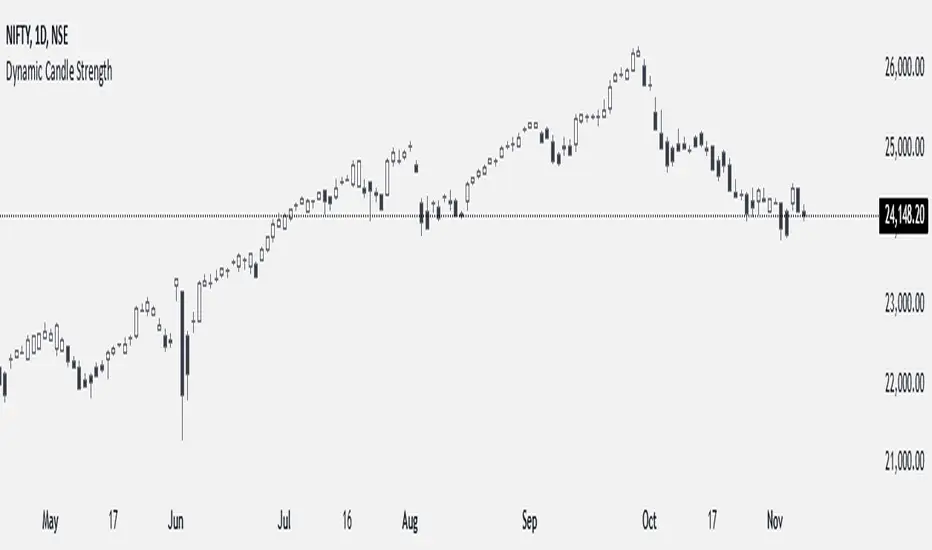
How It Works
Initialization of Dynamic Levels:
The first candle's high and low are taken as the initial dynamic high and dynamic low levels.
If the next candle's close price is above the dynamic high, the candle is colored green, indicating bullish conditions.
If the next candle's close price is below the dynamic low, the candle is colored black, indicating bearish conditions.
If a candle's high and low crossed both the dynamic high and dynamic low, the dynamic high and low levels are updated to the high and low of that candle, but the candle color will continue with the same color as the previous candle.
Maintaining and Updating Dynamic Levels:
The dynamic high and low are only updated if a candle's close is above the current dynamic high or below the current dynamic low.
If the candle does not close above or below these levels, the dynamic high and low remain unchanged.
Visual Signals:
Green Bars: Indicate that the candle's close is above the dynamic high, suggesting bullish conditions.
Black Bars: Indicate that the candle's close is below the dynamic low, suggesting bearish conditions.
This method ensures that the dynamic high and low levels are adjusted in real-time based on the most recent significant price movements, providing a reliable measure of market sentiment.
Notas de Lançamento
Dynamic Variables: The script defines dynamicHigh, dynamicLow, dynamicOpen, and dynamicClose to track the high, low, open, and close values of candles.Update Dynamic Values: Dynamic values are updated based on the close price. If dynamicHigh or dynamicLow is na, or if the current close breaches either threshold, the values are set to the current candle's high, low, open, and close.
Determine Bullish and Bearish Conditions: The script checks if dynamicClose is less than dynamicOpen to identify bearish conditions or if dynamicClose is greater than dynamicOpen for bullish conditions.
Bar Color: Bars are colored green when dynamicClose is greater than dynamicOpen, indicating a bullish condition, and red when it is less, indicating a bearish condition.
Notas de Lançamento
The previous version was not able to handle gap-up or gap-down situations, so those conditions have been added.Notas de Lançamento
The previous version was not able to handle gap-up or gap-down situations, so those conditions have been added.Script de código aberto
Em verdadeiro espírito do TradingView, o criador deste script o tornou de código aberto, para que os traders possam revisar e verificar sua funcionalidade. Parabéns ao autor! Embora você possa usá-lo gratuitamente, lembre-se de que a republicação do código está sujeita às nossas Regras da Casa.
Sreenureddy
Aviso legal
As informações e publicações não se destinam a ser, e não constituem, conselhos ou recomendações financeiras, de investimento, comerciais ou de outro tipo fornecidos ou endossados pela TradingView. Leia mais nos Termos de Uso.
Script de código aberto
Em verdadeiro espírito do TradingView, o criador deste script o tornou de código aberto, para que os traders possam revisar e verificar sua funcionalidade. Parabéns ao autor! Embora você possa usá-lo gratuitamente, lembre-se de que a republicação do código está sujeita às nossas Regras da Casa.
Sreenureddy
Aviso legal
As informações e publicações não se destinam a ser, e não constituem, conselhos ou recomendações financeiras, de investimento, comerciais ou de outro tipo fornecidos ou endossados pela TradingView. Leia mais nos Termos de Uso.