PROTECTED SOURCE SCRIPT
Atualizado CPR By Ask Dinesh Kumar(ADK)
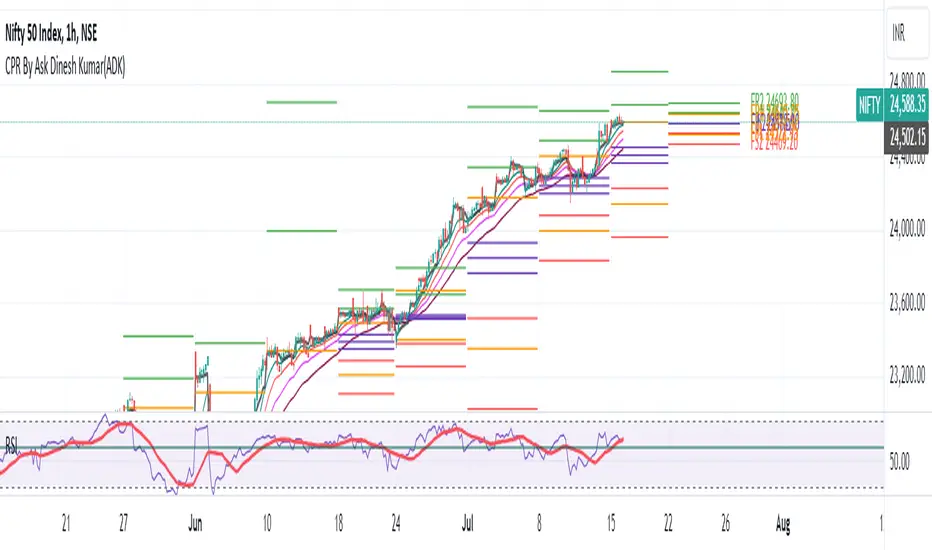
Simple CPR Indicator to increase probability of profitable trades:

The Central Pivot Range (CPR) is a trading tool used by traders to identify potential support and resistance levels in the market. Here's a simplified explanation of how traders can potentially profit using the Central Pivot Range with 10 lines:
1. *Understanding CPR*: CPR consists of three lines: the pivot point (PP), upper resistance level (R1), and lower support level (S1). Additionally, traders often add five more of profitable tradeslines above and below the PP to create a 10-line CPR.
2. *Identify Trend*: Determine the prevailing market trend. If the market is bullish, traders will look for buying opportunities near support levels. If the market is bearish, they'll seek selling opportunities near resistance levels.
3. *Entry Points*: Look for entry points near the support (S1) or resistance (R1) levels within the CPR. These levels can act as potential turning points where price may reverse.
4. *Risk Management*: Set stop-loss orders to manage risk. Stop-loss orders should be placed slightly below support levels for long positions and slightly above resistance levels for short positions.
5. *Profit Targets*: Determine profit targets based on the distance between entry point and the next support or resistance level. Some traders use a risk-reward ratio to ensure potential profits outweigh potential losses.
6. *Confirmation*: Use additional technical indicators or price action patterns to confirm potential entry or exit points within the CPR.
7. *Monitor Price Action*: Continuously monitor price action around the CPR levels. Traders should be prepared to adjust their positions if price breaks through support or resistance levels convincingly.
8. *Trade Management*: Once in a trade, actively manage it by adjusting stop-loss orders, trailing stops, or taking partial profits as price moves in the desired direction.
9. *Market Conditions*: Consider broader market conditions, such as economic indicators, geopolitical events, or news releases, which can impact price movements and the effectiveness of CPR.
10. *Practice and Analysis*: Practice using CPR on historical price charts and analyze past trades to refine strategies and improve decision-making skills.
Remember, trading involves risks, and no strategy guarantees profits. It's essential to thoroughly understand the concepts behind CPR and practice disciplined risk management to increase the likelihood of successful trades.
How does central pivot range work:
Sure here's a concise explanation of how the Central Pivot Range (CPR) works in 10 points:
1. *Calculation*: CPR is calculated using the previous day's high (H), low (L), and close (C) prices.
2. *Pivot Point (PP)*: The central point of CPR is the average of the previous day's high, low, and close prices: PP = (H + L + C) / 3.
3. *Upper Resistance Levels (R1, R2, R3)*: These are potential price levels above the pivot point where resistance may occur. They are calculated by adding a multiple of the range (H - L) to the pivot point: R1 = (2 * PP) - L, R2 = PP + (H - L), R3 = PP + 2 * (H - L).
4. *Lower Support Levels (S1, S2, S3)*: These are potential price levels below the pivot point where support may occur. They are calculated similarly to resistance levels but subtracting multiples of the range from the pivot point: S1 = (2 * PP) - H, S2 = PP - (H - L), S3 = PP - 2 * (H - L).
5. *Trading Signals*: Traders use CPR to identify potential support and resistance levels where price may reverse or stall.
6. *Range Bound Markets*: In range-bound markets, traders may buy near support levels (S1, S2, S3) and sell near resistance levels (R1, R2, R3).
7. *Breakout Trading*: When price breaks through a CPR level convincingly, it may indicate a potential trend continuation or reversal, providing breakout trading opportunities.
8. *Volume and Momentum*: Traders often look for confirmation from volume and momentum indicators when price approaches CPR levels.
9. *Intraday Trading*: CPR can be applied to intraday timeframes as well, providing shorter-term traders with potential trading levels for the day.
10. *Dynamic Indicator*: CPR is dynamic and recalculates daily based on new price data, allowing traders to adapt their strategies to current market conditions.
Understanding how to interpret CPR levels and integrate them into a trading strategy can help traders identify potential entry and exit points in the market.
Notas de Lançamento
- Now Prev. High and Prev. low are enabled by default.
- Reverting colors of resistances and support bars to show clear perspective of upside and downside of cpr.
- Moving avarage are also enabled by default.
- Colorise MA1, MA2, MA3 for clearity.
Notas de Lançamento
Indicators Updated and Added on Request- MA 4 is Added. Now MA1=8, MA2=13, MA3=21, MA4=34.
- All Moving Averages Are Enabled by Default.
- Added VWAP.
- VWAP is Enabled By Default.
Notas de Lançamento
- Bugfix : Future CPR is overlapping on some time frames. Now Show properly on every Timeframe.
- Now Future CPR can be Extend. Option added
- Some Optimization done.
Notas de Lançamento
- Optimizing for performance
- Changing defaults of some options
Script protegido
Esse script é publicada como código fechado. No entanto, você pode gerenciar suas escolhas de bate-papo. Por favor, abra suas Configurações do perfil
Aviso legal
As informações e publicações não se destinam a ser, e não constituem, conselhos ou recomendações financeiras, de investimento, comerciais ou de outro tipo fornecidos ou endossados pela TradingView. Leia mais nos Termos de Uso.