OPEN-SOURCE SCRIPT
Atualizado Trading Channel Index (TCI)
Overview:
The Trading Channel Index (TCI) is a technical analysis tool designed to identify cyclical trends in financial markets by smoothing out price movements and reducing volatility compared to traditional oscillators, like the Commodity Channel Index (CCI). The TCI helps traders pinpoint overbought and oversold conditions, as well as gauge the strength and direction of market trends.
Calculation:
The TCI is calculated through a multi-step process:
Indicator Variables:
Usage:
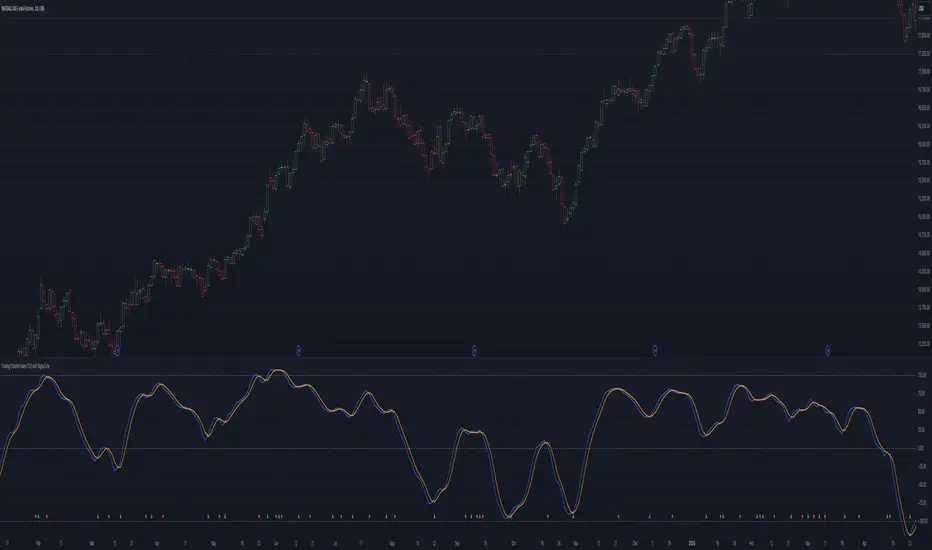
Overbought and Oversold Conditions: The TCI often uses levels such as +100 and -100 to identify potential reversal points. When the TCI crosses above +100, it might indicate an overbought condition, signaling a potential sell. Conversely, when it crosses below -100, it could indicate an oversold condition, suggesting a potential buy.
Trend Identification: Sustained values above 0 typically indicate a bullish trend, while values below 0 suggest a bearish trend. The TCI's smoothness helps traders stay in trends longer by reducing the impact of short-term market noise.
Conclusion:
The Trading Channel Index (TCI) is a versatile and powerful tool for traders who wish to capture cyclical price movements with a reduced level of noise. By adjusting the TCI Channel Length and TCI Average Length, traders can tailor the indicator to suit different market conditions, making it applicable across various timeframes and asset classes.
The Trading Channel Index (TCI) is a technical analysis tool designed to identify cyclical trends in financial markets by smoothing out price movements and reducing volatility compared to traditional oscillators, like the Commodity Channel Index (CCI). The TCI helps traders pinpoint overbought and oversold conditions, as well as gauge the strength and direction of market trends.
Calculation:
The TCI is calculated through a multi-step process:
- Typical Price (Xt): The typical price is computed as the average of the high, low, and close prices for each bar:
Pine Script® Xt = (High + Low + Close) / 3 - Exponential Average (Et): This step smooths the typical price over a specified number of bars (TCI Channel Length) using an exponential moving average (EMA). The smoothing factor alpha is derived from the channel length:
Pine Script® Et = alpha * Xt + (1 - alpha) * Et[1]
Where alpha = 2 / (TCI Channel Length + 1). - Average Deviation (Dt): The average deviation measures how much the typical price deviates from the exponential average over time. This is also smoothed using the EMA:
Pine Script® Dt = alpha * abs(Et - Xt) + (1 - alpha) * Dt[1] - Channel Index (CI): The Channel Index is calculated by normalizing the difference between the typical price and the exponential average by the average deviation:
Pine Script® CI = (Xt - Et) / (0.15 * Dt) - Trading Channel Index (TCI): Finally, the TCI is generated by applying additional smoothing to the Channel Index using another EMA over the specified number of bars (TCI Average Length). The smoothing factor beta is derived from the average length:
Pine Script® TCI = beta * CI + (1 - beta) * TCI[1]
Indicator Variables:
- TCI Channel Length:
- Description: This variable sets the number of historical bars used to calculate the Channel Index (CI). A shorter length results in a more sensitive CI that responds quickly to price changes, while a longer length produces a smoother and less volatile CI.
- Default Value: 21 - TCI Average Length:
-Description: This variable determines the number of bars over which the Channel Index (CI) is smoothed to produce the TCI. A shorter length makes the TCI more responsive to recent price changes, whereas a longer length further smooths the TCI, reducing its sensitivity to short-term fluctuations.
-Default Value: 10
Usage:
Overbought and Oversold Conditions: The TCI often uses levels such as +100 and -100 to identify potential reversal points. When the TCI crosses above +100, it might indicate an overbought condition, signaling a potential sell. Conversely, when it crosses below -100, it could indicate an oversold condition, suggesting a potential buy.
Trend Identification: Sustained values above 0 typically indicate a bullish trend, while values below 0 suggest a bearish trend. The TCI's smoothness helps traders stay in trends longer by reducing the impact of short-term market noise.
Conclusion:
The Trading Channel Index (TCI) is a versatile and powerful tool for traders who wish to capture cyclical price movements with a reduced level of noise. By adjusting the TCI Channel Length and TCI Average Length, traders can tailor the indicator to suit different market conditions, making it applicable across various timeframes and asset classes.
Notas de Lançamento
Trading Channel Index (TCI) IndicatorOverview:
The Trading Channel Index (TCI) is a technical analysis tool designed to identify cyclical trends in financial markets by smoothing out price movements and reducing volatility compared to traditional oscillators, like the Commodity Channel Index (CCI). The TCI helps traders pinpoint overbought and oversold conditions, as well as gauge the strength and direction of market trends.
Calculation:
The TCI is calculated through a multi-step process:
- Typical Price (Xt): The typical price is computed as the average of the high, low, and close prices for each bar:
Pine Script® Xt = (High + Low + Close) / 3 - Exponential Average (Et): This step smooths the typical price over a specified number of bars (TCI Channel Length) using an exponential moving average (EMA). The smoothing factor alpha is derived from the channel length:
Pine Script® Et = alpha * Xt + (1 - alpha) * Et[1]
Where alpha = 2 / (TCI Channel Length + 1). - Average Deviation (Dt): The average deviation measures how much the typical price deviates from the exponential average over time. This is also smoothed using the EMA:
Pine Script® Dt = alpha * abs(Et - Xt) + (1 - alpha) * Dt[1] - Channel Index (CI): The Channel Index is calculated by normalizing the difference between the typical price and the exponential average by the average deviation:
Pine Script® CI = (Xt - Et) / (0.15 * Dt) - Trading Channel Index (TCI): Finally, the TCI is generated by applying additional smoothing to the Channel Index using another EMA over the specified number of bars (TCI Average Length). The smoothing factor beta is derived from the average length:
Pine Script® TCI = beta * CI + (1 - beta) * TCI[1]
Where beta = 2 / (TCI Average Length + 1).
Indicator Variables:
- TCI Channel Length:
- Description: This variable sets the number of historical bars used to calculate the Channel Index (CI). A shorter length results in a more sensitive CI that responds quickly to price changes, while a longer length produces a smoother and less volatile CI.
- Default Value: 14 - TCI Average Length
Description: This variable determines the number of bars over which the Channel Index (CI) is smoothed to produce the TCI. A shorter length makes the TCI more responsive to recent price changes, whereas a longer length further smooths the TCI, reducing its sensitivity to short-term fluctuations.
- Default Value: 10 - Signal Line Type and Length
- The TCI Signal Line is a smoothed version of the TCI that helps filter out noise. Crossovers between the TCI and the Signal Line can indicate potential entry or exit points for trades.You can customize both the type of moving average (SMA or EMA) and the length of the signal line to fit your trading strategy.
- Default Value: 3, SMA
Usage:
- Overbought and Oversold Conditions: The TCI often uses levels such as +100 and -100 to identify potential reversal points. When the TCI crosses above +100, it might indicate an overbought condition, signaling a potential sell. Conversely, when it crosses below -100, it could indicate an oversold condition, suggesting a potential buy.
- Trend Identification: Sustained values above 0 typically indicate a bullish trend, while values below 0 suggest a bearish trend. The TCI's smoothness helps traders stay in trends longer by reducing the impact of short-term market noise.
- Signal Line: The signal line is based on either the Simple Moving Average (SMA) or Exponential Moving Average (EMA), as selected by the user, with a customizable length.
- Crossover Signals: The script plots a signal on the chart whenever the TCI crosses the signal line, indicating potential entry or exit points.
Conclusion:
The Trading Channel Index (TCI) is a versatile and powerful tool for traders who wish to capture cyclical price movements with a reduced level of noise. By adjusting the TCI Channel Length and TCI Average Length, traders can tailor the indicator to suit different market conditions, making it applicable across various timeframes and asset classes.
Script de código aberto
Em verdadeiro espírito do TradingView, o criador deste script o tornou de código aberto, para que os traders possam revisar e verificar sua funcionalidade. Parabéns ao autor! Embora você possa usá-lo gratuitamente, lembre-se de que a republicação do código está sujeita às nossas Regras da Casa.
Aviso legal
As informações e publicações não se destinam a ser, e não constituem, conselhos ou recomendações financeiras, de investimento, comerciais ou de outro tipo fornecidos ou endossados pela TradingView. Leia mais nos Termos de Uso.