OPEN-SOURCE SCRIPT
Background Up or Down
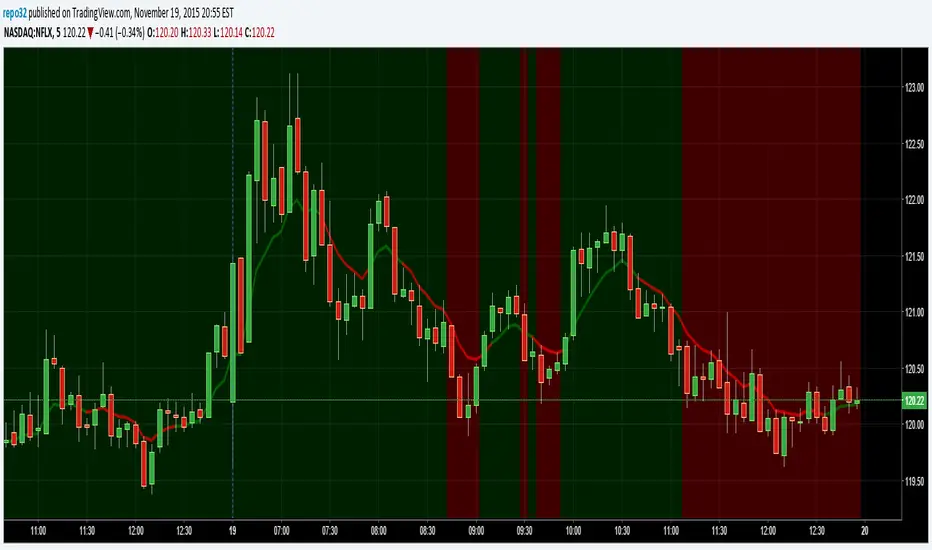
This script will color the background based upon whether it is positive or negative for the day. When looking at numerous charts, you can instantly see if they are up or down for the day. For me, I like to be going long on the stocks that are already moving up and short on the ones that are moving down. When using lower time frames, you can lose perspective of where it is on the daily chart.
On the example above, you can see a 5 minute chart of NFLX. It shows you when it dropped below the previous days close.
On the example above, you can see a 5 minute chart of NFLX. It shows you when it dropped below the previous days close.
Script de código aberto
Em verdadeiro espírito do TradingView, o criador deste script o tornou de código aberto, para que os traders possam revisar e verificar sua funcionalidade. Parabéns ao autor! Embora você possa usá-lo gratuitamente, lembre-se de que a republicação do código está sujeita às nossas Regras da Casa.
Aviso legal
As informações e publicações não se destinam a ser, e não constituem, conselhos ou recomendações financeiras, de investimento, comerciais ou de outro tipo fornecidos ou endossados pela TradingView. Leia mais nos Termos de Uso.