OPEN-SOURCE SCRIPT
Atualizado Detrended Price Oscillator with projected SMA
Haven't seen any DPO scripts like this one...
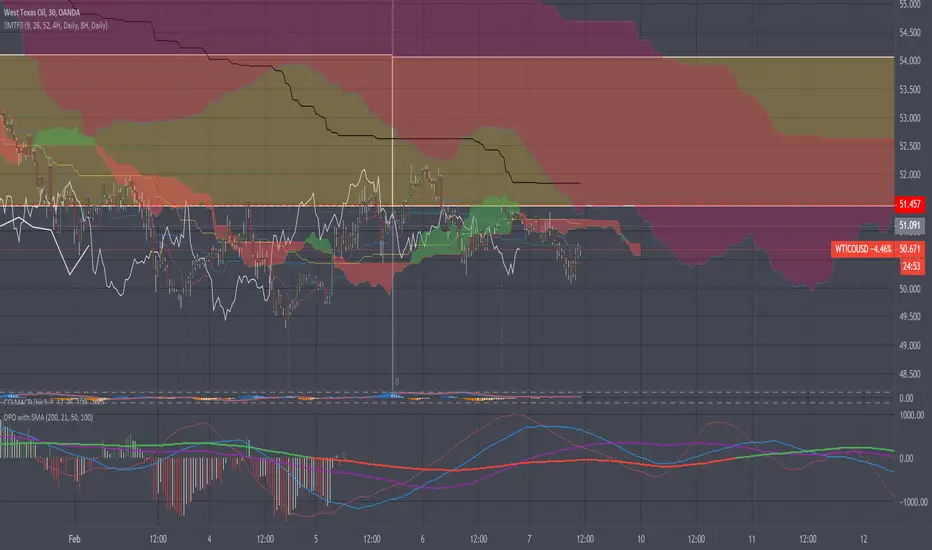
Dpo is generaly use to find cycles in the market rather than prices trends.
As you can see a centralized Dpo is ploted with barsback *actual is shown behing actual price timeline.
Using timeline diferences between the two last highest or the two last lowest histogram bands can give you an aproximation of those market cycles.
Dpo SMA's trends can also be use to compare actual price timeline direction in 3 ways...
#-1: Is the actual price (candles) trend is against or with the dpo SMA's (convergence;divergence) ?
#-2: Is the actual price trend is condensed or dispersed ( criticals values)?
#-3: Does the dpo SMA's are near or far from the dpo cycle bottoms or cycle tops ?
Make sure to know that this indicator isn't a trading reccomandation and may not be suited for your trading style as well that it can be badly interpreted. USE WITH CAUTIONS !
//----Coder----//
R.V.
//----Thanx----//
Notas de Lançamento
AutoSMA above or below 0 color changeScript de código aberto
Em verdadeiro espírito do TradingView, o criador deste script o tornou de código aberto, para que os traders possam revisar e verificar sua funcionalidade. Parabéns ao autor! Embora você possa usá-lo gratuitamente, lembre-se de que a republicação do código está sujeita às nossas Regras da Casa.
Aviso legal
As informações e publicações não se destinam a ser, e não constituem, conselhos ou recomendações financeiras, de investimento, comerciais ou de outro tipo fornecidos ou endossados pela TradingView. Leia mais nos Termos de Uso.
Script de código aberto
Em verdadeiro espírito do TradingView, o criador deste script o tornou de código aberto, para que os traders possam revisar e verificar sua funcionalidade. Parabéns ao autor! Embora você possa usá-lo gratuitamente, lembre-se de que a republicação do código está sujeita às nossas Regras da Casa.
Aviso legal
As informações e publicações não se destinam a ser, e não constituem, conselhos ou recomendações financeiras, de investimento, comerciais ou de outro tipo fornecidos ou endossados pela TradingView. Leia mais nos Termos de Uso.