Viés de alta
LINAUSDT.1D

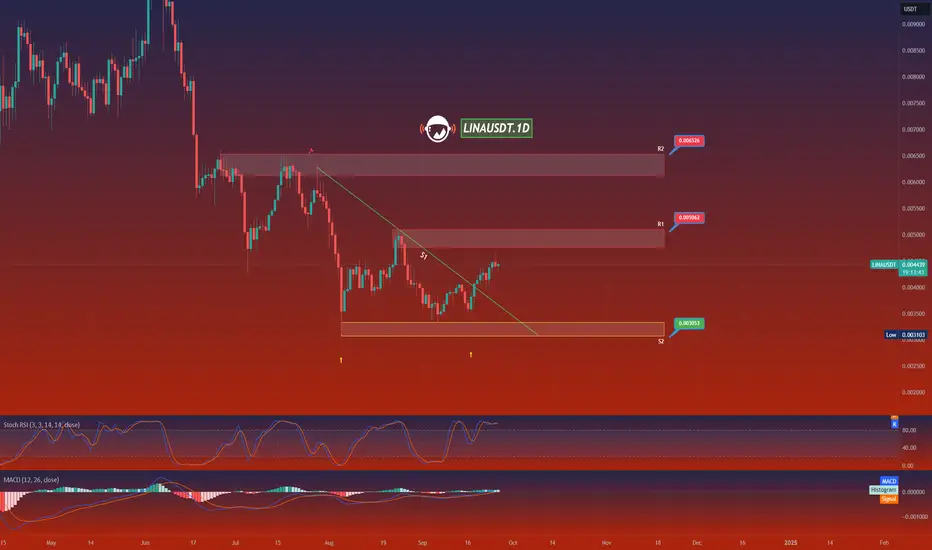
In the technical analysis chart provided for LINA/USDT on TradingView, we observe a detailed representation of Linear's price movement against the US Dollar Tether on a daily timeframe. The chart identifies two key resistance levels (R1 at $0.005062 and R2 at $0.005626) and two support levels (S1 at $0.003053 and S2 significantly lower, near the lowest visible range of the chart).
The price action shows that LINA has experienced a significant downtrend from earlier peaks, stabilizing into a consolidation phase around S1. Recently, the price seems to have broken this consolidation phase with a slight upward movement towards R1. This suggests a potential shift in market sentiment from bearish to cautiously bullish, as the market tries to reclaim higher levels.
The presence of support and resistance levels provides a clear framework for potential trade setups. If the price sustains above the S1 level and breaks through the R1 resistance, it may attempt to reach R2. This would indicate increasing buyer momentum and could present a buying opportunity. However, if the price fails to break R1 and retraces back towards S1, it could reaffirm the existing bearish sentiment, suggesting a watch-and-wait approach for a potential sell on a downtrend resumption.
For trading strategy, I would focus on the response of the price at these key levels. A break and hold above R1 can be seen as a bullish signal, potentially leading to trades targeting R2, with stops below R1 to manage risk. Conversely, a failure at R1 and a subsequent fall below S1 could trigger bearish trades, targeting lower support levels, ensuring stops are placed just above the breakdown point to limit potential losses.
In conclusion, while the chart presents an opportunity for both bullish and bearish scenarios, closely monitoring price action at these pivotal levels will be crucial. Traders should also consider broader market sentiment and news that may impact the price dynamics of LINA. As always, employing a disciplined risk management strategy will be key to navigating the potential volatility in this market effectively.
Aviso legal
As informações e publicações não devem ser e não constituem conselhos ou recomendações financeiras, de investimento, de negociação ou de qualquer outro tipo, fornecidas ou endossadas pela TradingView. Leia mais em Termos de uso.