Viés de alta
Bitcoin Analyze (Short Term, Timeframe 2H)!!!🧐

If we look at carefully to Bitcoin chart at the 2H timeframe, we can see the Inverted Hammer & Tweezer Bottom candlestick patterns inside the support lines.
Also, we can see Regular Divergence (RD+) in RSI Indicator.
I expect Bitcoin to go up(about ➕4%) to near the Resistance line & Monthly Pivot Point (Better, we wait for the trigger of the candlestick pattern).
❗️Note❗️: under 20720$, Bitcoin will continue to fall.
If you don't know about candlestick patterns, you can visit this post👇
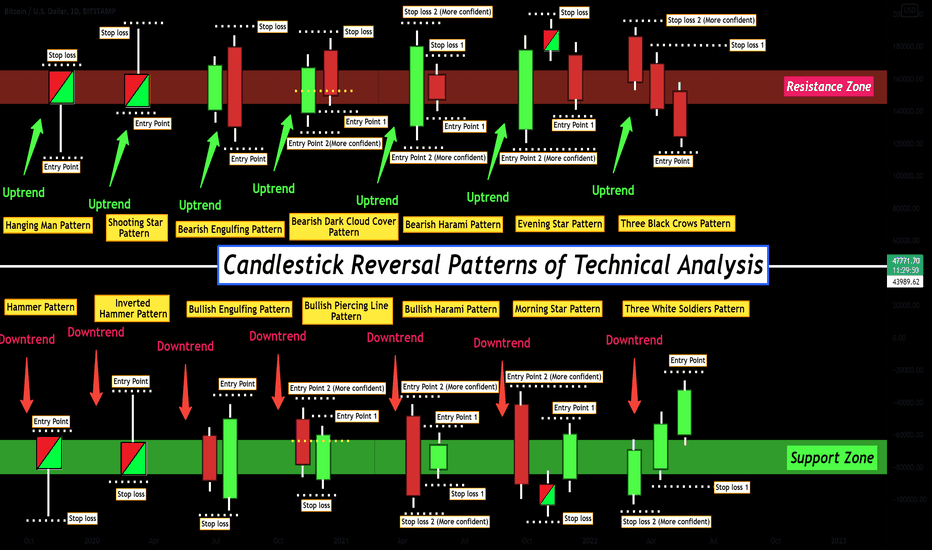
Bitcoin Analyze ( BTCUSDT ) Timeframe 2H⏰
Do not forget to put Stop loss for your positions (For every position that you want to open).
Please follow your strategy, this is just my Idea, and I will be glad to see your ideas in this post.
Please do not forget the ✅' like'✅ button 🙏😊 & Share it with your friends; thanks, and Trade safe.
Also, we can see Regular Divergence (RD+) in RSI Indicator.
I expect Bitcoin to go up(about ➕4%) to near the Resistance line & Monthly Pivot Point (Better, we wait for the trigger of the candlestick pattern).
❗️Note❗️: under 20720$, Bitcoin will continue to fall.
If you don't know about candlestick patterns, you can visit this post👇
Bitcoin Analyze ( BTCUSDT ) Timeframe 2H⏰
Do not forget to put Stop loss for your positions (For every position that you want to open).
Please follow your strategy, this is just my Idea, and I will be glad to see your ideas in this post.
Please do not forget the ✅' like'✅ button 🙏😊 & Share it with your friends; thanks, and Trade safe.
👑Real & Accurcy Free & VIP Signals👉 t.me/ProTrader_365
🎁Get a 20% Discount on your trading FEE on BYBIT:👉partner.bybit.com/b/PEJMANZWIN
🎁Get a 20% Bonus & 30% Discount on LBANK exchange(NO KYC)👉lbank.one/join/uBythQd
🎁Get a 20% Discount on your trading FEE on BYBIT:👉partner.bybit.com/b/PEJMANZWIN
🎁Get a 20% Bonus & 30% Discount on LBANK exchange(NO KYC)👉lbank.one/join/uBythQd
Publicações relacionadas
Aviso legal
As informações e publicações não devem ser e não constituem conselhos ou recomendações financeiras, de investimento, de negociação ou de qualquer outro tipo, fornecidas ou endossadas pela TradingView. Leia mais em Termos de uso.