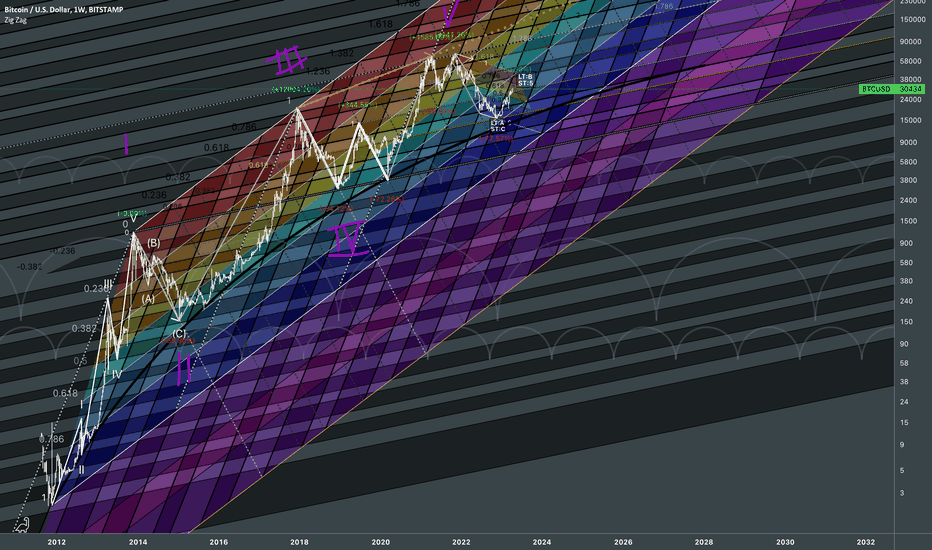
Bitcoin Bullrun or Pullback for now?
Atualizado

Just a cleaner zoomed in version of Bitcoin Fractal Dimensions II with important visualized details.
Since we've already covered the point of my irregular use of fibonacci channels for simulating the market, it's time to break down the candle data even further to justify whether Fibs are priced in at the right levels.

I'd qualify this as a bullrun if price fails to stop at hot colors or at final red zone for significant correction. If correction is going to be relatively weak, then it would only add "probability points" in favor for a bullrun. Fibonacci itself defines the probability of price movement in Fractal Analysis.

Source for the long-term fibonacci channels:

Since we've already covered the point of my irregular use of fibonacci channels for simulating the market, it's time to break down the candle data even further to justify whether Fibs are priced in at the right levels.
I'd qualify this as a bullrun if price fails to stop at hot colors or at final red zone for significant correction. If correction is going to be relatively weak, then it would only add "probability points" in favor for a bullrun. Fibonacci itself defines the probability of price movement in Fractal Analysis.
Source for the long-term fibonacci channels:

Unlock exclusive tools: fractlab.com
ᴀʟʟ ᴄᴏɴᴛᴇɴᴛ ᴘʀᴏᴠɪᴅᴇᴅ ʙʏ ꜰʀᴀᴄᴛʟᴀʙ ɪꜱ ɪɴᴛᴇɴᴅᴇᴅ ꜰᴏʀ ɪɴꜰᴏʀᴍᴀᴛɪᴏɴᴀʟ ᴀɴᴅ ᴇᴅᴜᴄᴀᴛɪᴏɴᴀʟ ᴘᴜʀᴘᴏꜱᴇꜱ ᴏɴʟʏ.
ᴘᴀꜱᴛ ᴘᴇʀꜰᴏʀᴍᴀɴᴄᴇ ɪꜱ ɴᴏᴛ ɪɴᴅɪᴄᴀᴛɪᴠᴇ ᴏꜰ ꜰᴜᴛᴜʀᴇ ʀᴇꜱᴜʟᴛꜱ.
ᴀʟʟ ᴄᴏɴᴛᴇɴᴛ ᴘʀᴏᴠɪᴅᴇᴅ ʙʏ ꜰʀᴀᴄᴛʟᴀʙ ɪꜱ ɪɴᴛᴇɴᴅᴇᴅ ꜰᴏʀ ɪɴꜰᴏʀᴍᴀᴛɪᴏɴᴀʟ ᴀɴᴅ ᴇᴅᴜᴄᴀᴛɪᴏɴᴀʟ ᴘᴜʀᴘᴏꜱᴇꜱ ᴏɴʟʏ.
ᴘᴀꜱᴛ ᴘᴇʀꜰᴏʀᴍᴀɴᴄᴇ ɪꜱ ɴᴏᴛ ɪɴᴅɪᴄᴀᴛɪᴠᴇ ᴏꜰ ꜰᴜᴛᴜʀᴇ ʀᴇꜱᴜʟᴛꜱ.
Publicações relacionadas
Aviso legal
As informações e publicações não devem ser e não constituem conselhos ou recomendações financeiras, de investimento, de negociação ou de qualquer outro tipo, fornecidas ou endossadas pela TradingView. Leia mais em Termos de uso.