Viés de baixa
Can the Kiss of Death send Bitcoin to 2300?
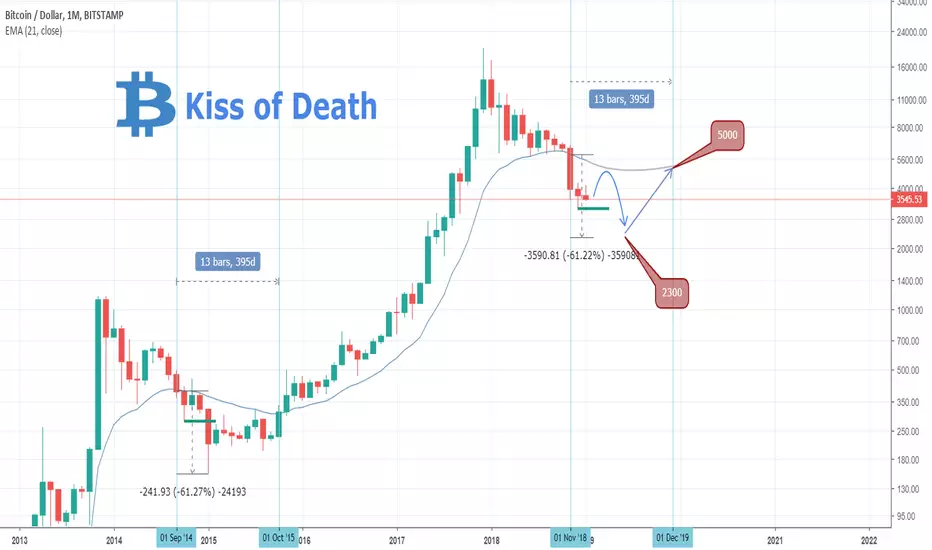
Pattern: Kiss of Death on 1M.
Signal: Bearish.
Target: 2300.
This is a typical bearish pattern. The price falls below the 21EMA and revisits the line from below, "kissing" it and getting rejected. In 2014/2015 it bottomed after a -61.27% fall. The same degree puts the bearish target/ bottom at 2300. The duration of the 2014/2015 pattern until the time it broke the 21EMA was 395 days. This places the start of the next bullish run on December 2019.
👑Best Signals (Forex/Crypto+70% accuracy) & Account Management (+20% profit/month on 10k accounts)
💰Free Channel t.me/tradingshotglobal
🤵Contact info@tradingshot.com t.me/tradingshot
🔥New service: next X100 crypto GEMS!
💰Free Channel t.me/tradingshotglobal
🤵Contact info@tradingshot.com t.me/tradingshot
🔥New service: next X100 crypto GEMS!
Aviso legal
As informações e publicações não devem ser e não constituem conselhos ou recomendações financeiras, de investimento, de negociação ou de qualquer outro tipo, fornecidas ou endossadas pela TradingView. Leia mais em Termos de uso.