This analysis provides a comprehensive trading plan for the BANKNIFTY index on March 3, 2025, covering all possible opening scenarios. We will evaluate Gap-Up, Flat, and Gap-Down openings (with gaps of 200+ points) and outline clear action points, key levels, and risk management strategies. This plan is designed to help traders navigate the market with precision and discipline. 📈🔍
🔹 Scenario 1: Gap-Up Opening (200+ points)
If BANKNIFTY opens above 49,131 (a gap of 200+ points from the previous close of 48,931), it signals strong bullish momentum. This opening suggests aggressive buying interest, potentially driving prices higher after recent downside pressure.
- [] If the price sustains above 49,131, it could target the resistance zone of 49,524–49,782. This zone is a profit-booking area where selling pressure may intensify due to historical resistance and recent highs.
[] If the price faces rejection at 49,524–49,782, a reversal trade could be considered, targeting a pullback to 48,813–48,931 (opening support/resistance and previous close). - Should the price break above 49,782 with strong momentum (e.g., high volume and bullish candlestick patterns), we might see a rally toward 50,000 or higher.
✅ Trade Plan:
✔️ Buy on a breakout and retest of 49,131, targeting 49,524–49,782. Use a stop-loss below 48,931 to manage risk.
✔️ Short if the price rejects 49,524–49,782, aiming for 48,813–48,931. Place a stop-loss above 49,782 to limit potential losses.
Explanation: A Gap-Up opening of 200+ points indicates a potential reversal from the recent downtrend. Waiting for a retest of 49,131 confirms bullish intent, while the resistance at 49,524–49,782 acts as a natural profit-taking zone. A rejection at this level could signal a shorting opportunity if bearish momentum resurfaces.
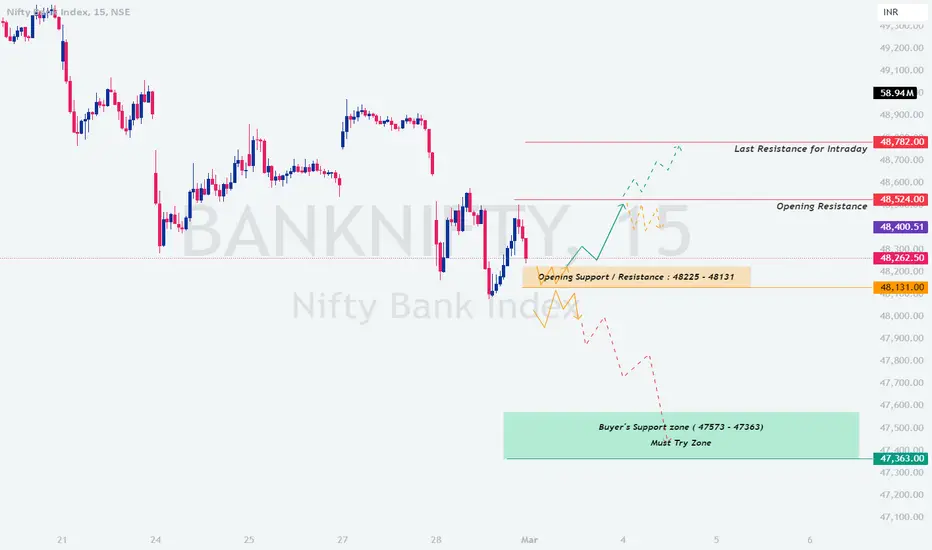
🔹 Scenario 2: Flat Opening (Near 48,931–48,813)
If BANKNIFTY opens within the range of 48,931–48,813, it suggests a balanced market with no clear directional bias, likely consolidating near recent support levels. This zone acts as a critical opening support/resistance area.- [] A breakout above 48,813 could drive prices toward 49,524–49,782, signaling bullish momentum and a possible trend reversal.
[] A breakdown below 48,931 might lead to selling pressure, targeting 47,573–47,363 (buyer’s support/must-try zone) or even 47,300 (key support level).
✅ Trade Plan:
✔️ Buy above 48,813, targeting 49,524–49,782. Use a stop-loss below 48,931 to protect against a false breakout.
✔️ Sell below 48,931, targeting 47,573–47,363 or 47,300. Set a stop-loss above 48,813 to manage downside risk.
Explanation: A Flat opening within the 48,931–48,813 range indicates the market is in a consolidation phase, a no-trade zone unless a breakout occurs. Traders should wait for clear price action (e.g., strong candlestick patterns or increased volume) to confirm a breakout above 48,813 for a bullish move or a breakdown below 48,931 for a bearish move, avoiding premature entries.
🔹 Scenario 3: Gap-Down Opening (200+ points)
If BANKNIFTY opens below 48,731 (a gap of 200+ points from the previous close of 48,931), it signals bearish sentiment and potential weakness, testing lower support levels.- [] Immediate support lies at 47,573–47,363 (buyer’s support/must-try zone). If this holds, a pullback toward 48,931–48,813 could occur.
[] If 47,573 breaks with strong selling pressure, expect further downside toward 47,300 (key support level for a possible reversal).
✅ Trade Plan:
✔️ Buy near 47,573, targeting a pullback to 48,931–48,813. Use a stop-loss below 47,363 to limit risk.
✔️ Short below 47,573, targeting 47,300. Place a stop-loss above 47,573 to protect against a quick recovery.
Explanation: A Gap-Down opening of 200+ points suggests continued downward pressure, but support at 47,573–47,363 could trigger a rebound if it holds. Waiting for confirmation near 47,573 ensures the price isn’t just oversold, while a break below this level confirms bearish momentum for shorting. The 47,300 zone is a critical level for a potential reversal if buying interest emerges.
📌 Risk Management Tips for Options Trading 💡
🛑 Always Use a Strict Stop-Loss: Protect your capital by setting stop-loss orders at key support/resistance levels to limit potential losses.
🎯 Take Partial Profits: Lock in gains at intermediate targets (e.g., 49,524 or 47,573) to secure profits while allowing room for further moves.
🕰️ Avoid Overtrading: Stick to the plan and wait for clear price action confirmation—don’t force trades in uncertain conditions.
💰 Use Proper Position Sizing: Risk only a small percentage of your capital (e.g., 1–2%) per trade to ensure longevity in the market.
📌 Summary & Conclusion 🎯
✔️ Bullish Above: 48,813 → Target: 49,524–49,782.
✔️ Bearish Below: 48,931 → Target: 47,573–47,363 or 47,300.
✔️ No Trade Zone: 48,931–48,813 (Wait for a breakout).
Trade with discipline, follow your plan, and prioritize risk management to navigate the BANKNIFTY market effectively on March 3, 2025. 🚀
⚠️ Disclaimer
I am not a SEBI-registered analyst. This analysis is for educational purposes only. Please consult your financial advisor before making any trading decisions. 📉📈
- [] Immediate support lies at 47,573–47,363 (buyer’s support/must-try zone). If this holds, a pullback toward 48,931–48,813 could occur.
- [] A breakout above 48,813 could drive prices toward 49,524–49,782, signaling bullish momentum and a possible trend reversal.
Aviso legal
As informações e publicações não devem ser e não constituem conselhos ou recomendações financeiras, de investimento, de negociação ou de qualquer outro tipo, fornecidas ou endossadas pela TradingView. Leia mais em Termos de uso.
Aviso legal
As informações e publicações não devem ser e não constituem conselhos ou recomendações financeiras, de investimento, de negociação ou de qualquer outro tipo, fornecidas ou endossadas pela TradingView. Leia mais em Termos de uso.