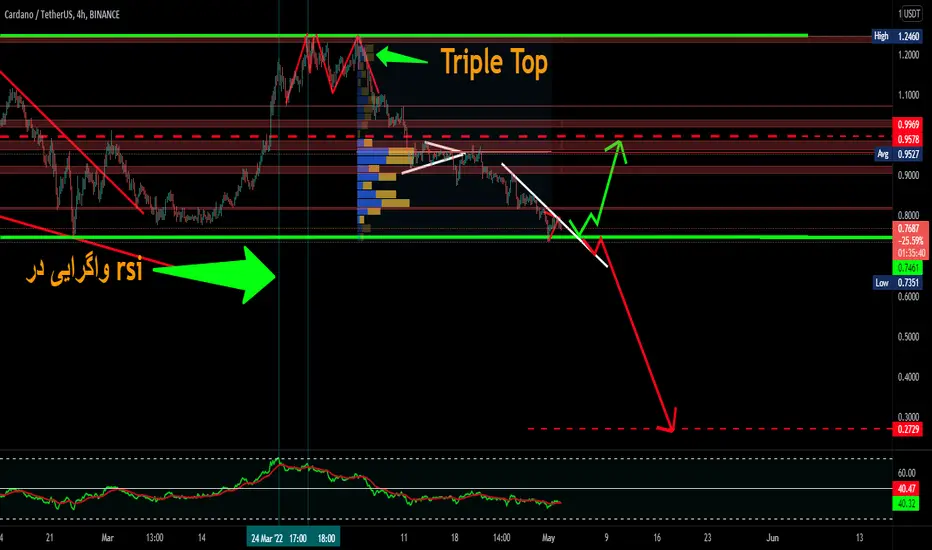
ADAUSDT chart
4 hours time frame
RECTANGLE pattern
If you are in the support area and see the DB floor pattern and the white trendline line breaks, you can see the area 0.9500 or 0.9969
But if the RECTANGLE pattern fails
Continuation of the downtrend
, Pulbeck can see area 0.2729
4 hours time frame
RECTANGLE pattern
If you are in the support area and see the DB floor pattern and the white trendline line breaks, you can see the area 0.9500 or 0.9969
But if the RECTANGLE pattern fails
Continuation of the downtrend
, Pulbeck can see area 0.2729
Aviso legal
As informações e publicações não devem ser e não constituem conselhos ou recomendações financeiras, de investimento, de negociação ou de qualquer outro tipo, fornecidas ou endossadas pela TradingView. Leia mais em Termos de uso.
Aviso legal
As informações e publicações não devem ser e não constituem conselhos ou recomendações financeiras, de investimento, de negociação ou de qualquer outro tipo, fornecidas ou endossadas pela TradingView. Leia mais em Termos de uso.