Sessions
Introduction
Session information is usable in three different ways in Pine Script™:
- Session strings containing from-to start times and day information that can be used in functions such as time() and time_close() to detect when bars are in a particular time period, with the option of limiting valid sessions to specific days. The input.session() function provides a way to allow script users to define session values through a script’s “Inputs” tab (see the Session input section for more information).
- Session states built-in variables such as session.ismarket can identify which session a bar belongs to.
- When fetching data with request.security() you can also choose to return data from regular sessions only or extended sessions. In this case, the definition of regular and extended sessions is that of the exchange. It is part of the instrument’s properties — not user-defined, as in point #1. This notion of regular and extended sessions is the same one used in the chart’s interface, in the “Chart Settings/Symbol/Session” field, for example.
The following sections cover both methods of using session information in Pine Script™.
Note that:
- Not all user accounts on TradingView have access to extended session information.
- There is no special “session” type in Pine Script™. Instead, session strings are of “string” type but must conform to the session string syntax.
Session strings
Session string specifications
Session strings used with time() and time_close() must have a specific format. Their syntax is:
<time_period>:<days>
Where:
- <time_period> uses times in “hhmm” format, with “hh” in 24-hour format, so
1700for 5PM. The time periods are in the “hhmm-hhmm” format, and a comma can separate multiple time periods to specify combinations of discrete periods.
- For example, - <days> is a set of digits from 1 to 7 that specifies on which days the session is valid.
- 1 is Sunday, 7 is Saturday.
Note
The default days are: 1234567, which is different in Pine Script™ v5 than in earlier versions where
23456 (weekdays) is used. For v5 code to reproduce the behavior from previous versions,
it should explicitly mention weekdays, as in "0930-1700:23456".
These are examples of session strings:
"24x7"- A 7-day, 24-hour session beginning at midnight.
"0000-0000:1234567"- Equivalent to the previous example.
"0000-0000"- Equivalent to the previous two examples because the default days are
1234567. "0000-0000:23456"- The same as the previous example, but only Monday to Friday.
"2000-1630:1234567"- An overnight session that begins at 20:00 and ends at 16:30 the next day. It is valid on all days of the week.
"0930-1700:146"- A session that begins at 9:30 and ends at 17:00 on Sundays (1), Wednesdays (4), and Fridays (6).
"1700-1700:23456"- An overnight session. The Monday session starts Sunday at 17:00 and ends Monday at 17:00. It is valid Monday through Friday.
"1000-1001:26"- A weird session that lasts only one minute on Mondays (2) and Fridays (6).
"0900-1600,1700-2000"- A session that begins at 9:00, breaks from 16:00 to 17:00, and continues until 20:00. Applies to every day of the week.
Using session strings
Session properties defined with session strings are independent of the exchange-defined sessions determining when an instrument can be traded. Programmers have complete liberty in creating whatever session definitions suit their purpose, which is usually to detect when bars belong to specific time periods. This is accomplished in Pine Script™ by using one of the following two signatures of the time() function:
time(timeframe, session, timezone) → series int
time(timeframe, session) → series int
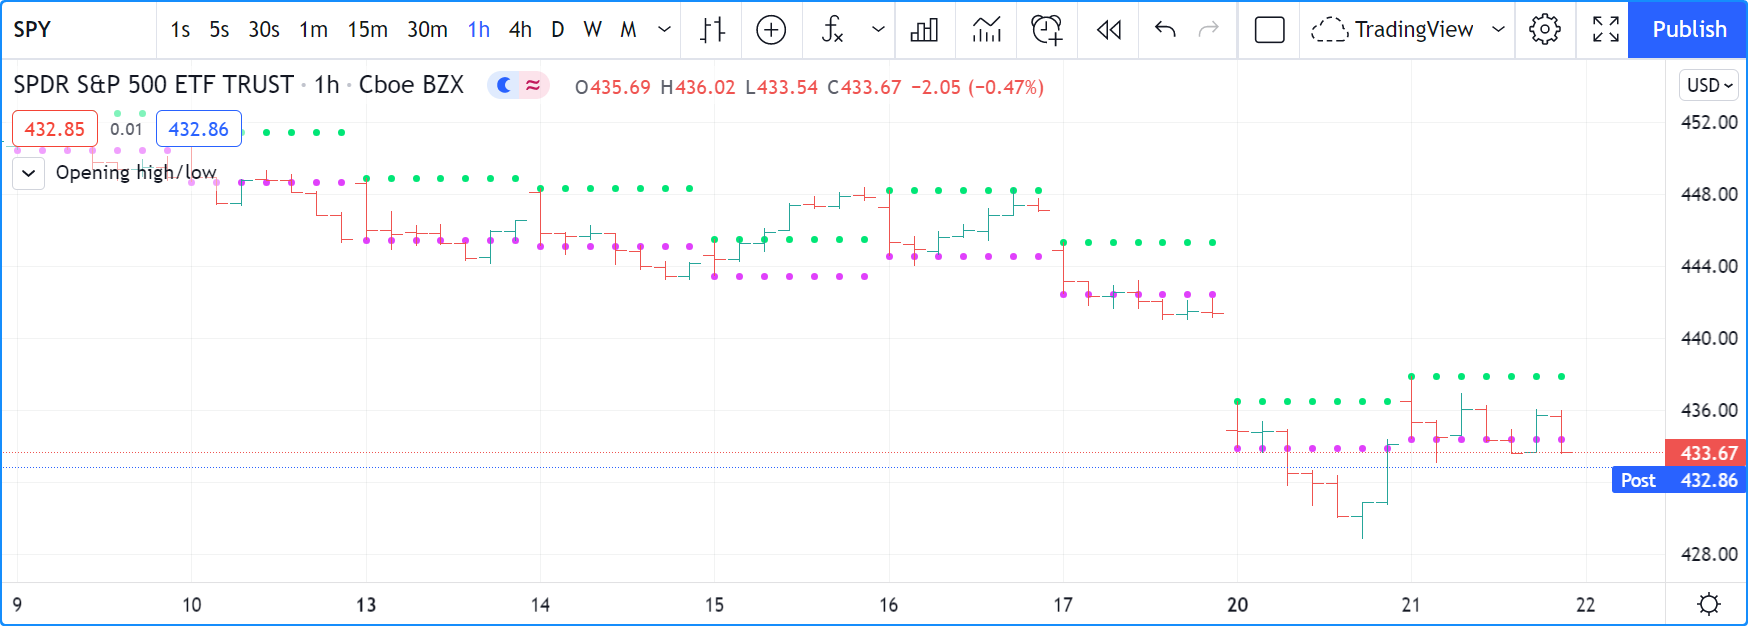
Here, we use time()
with a session argument to display the market’s opening
high and
low values on an intraday chart:
//@version=5
indicator("Opening high/low", overlay = true)

sessionInput = input.session("0930-0935")

sessionBegins(sess) =>
    t = time("", sess)
    timeframe.isintraday and (not barstate.isfirst) and na(t[1]) and not na(t)

var float hi = na
var float lo = na
if sessionBegins(sessionInput)
    hi := high
    lo := low

plot(lo, "lo", color.fuchsia, 2, plot.style_circles)
plot(hi, "hi", color.lime,    2, plot.style_circles)
Note that:
We use a session input to allow users to specify the time they want to detect. We are only looking for the session’s beginning time on bars, so we use a five-minute gap between the beginning and end time of our
"0930-0935"default value.We create a
sessionBegins()function to detect the beginning of a session. Itstime("", sess)call uses an empty string for the function’stimeframeparameter, which means it uses the chart’s timeframe, whatever that is. The function returnstruewhen:- The chart uses an intraday timeframe (seconds or minutes).
- The script isn’t on the chart’s first bar, which we ensure with
(not barstate.isfirst). This check prevents the code from always detecting a session beginning on the first bar becausena(t[1]) and not na(t)is alwaystruethere. - The time() call has returned na on the previous bar because it wasn’t in the session’s time period, and it has returned a value that is not na on the current bar, which means the bar is in the session’s time period.
Session states
Three built-in variables allow you to distinguish the type of session the current bar belongs to. They are only helpful on intraday timeframes:
- session.ismarket
returns
truewhen the bar belongs to regular trading hours. - session.ispremarket
returns
truewhen the bar belongs to the extended session preceding regular trading hours. - session.ispostmarket
returns
truewhen the bar belongs to the extended session following regular trading hours.
Using sessions with `request.security()`
When your TradingView account provides access to extended sessions, you can choose to see their bars with the “Settings/Symbol/Session” field. There are two types of sessions:
- regular (which does not include pre- and post-market data), and
- extended (which includes pre- and post-market data).
Scripts using the request.security() function to access data can return extended session data or not. This is an example where only regular session data is fetched:
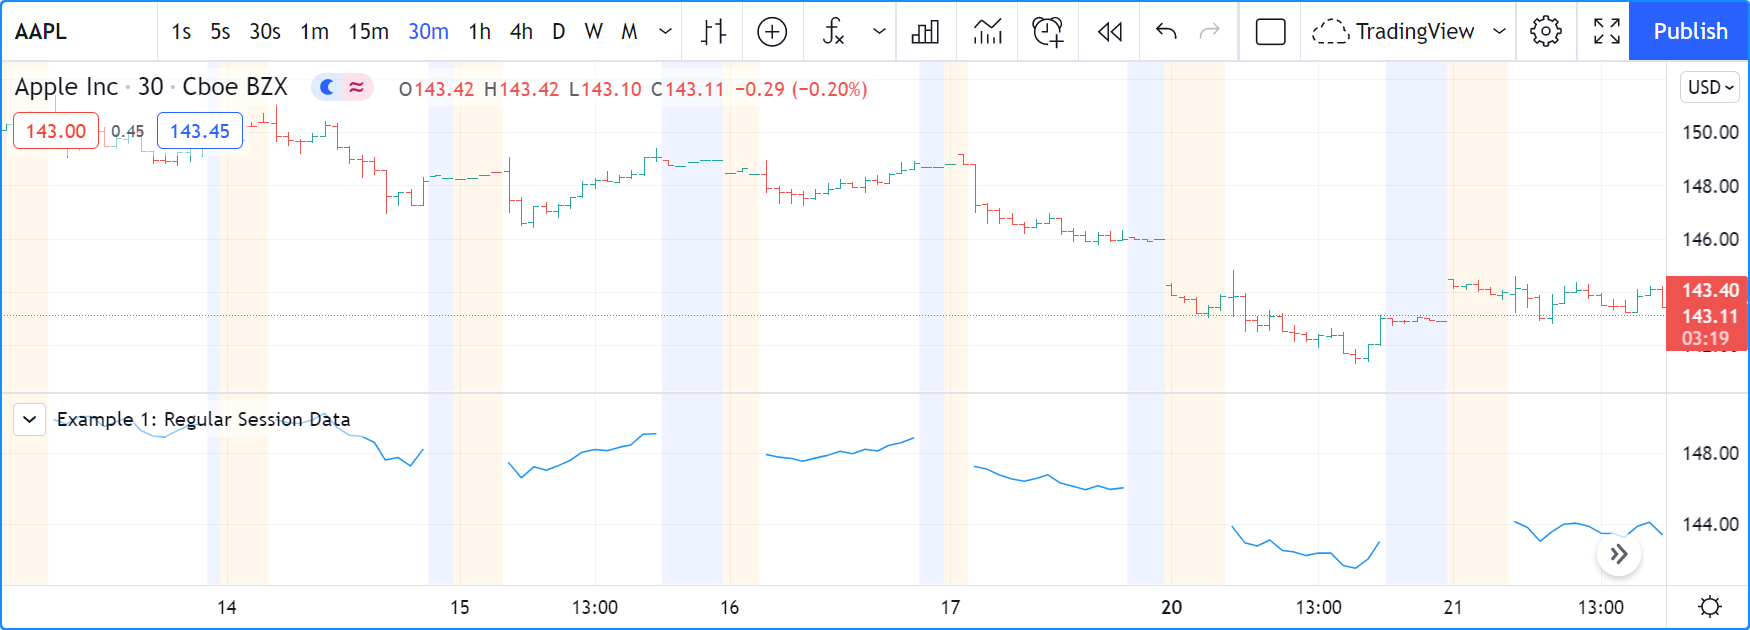
//@version=5
indicator("Example 1: Regular Session Data")
regularSessionData = request.security("NASDAQ:AAPL", timeframe.period, close, barmerge.gaps_on)
plot(regularSessionData, style = plot.style_linebr)
If you want the request.security() call to return extended session data, you must first use the ticker.new() function to build the first argument of the request.security() call:
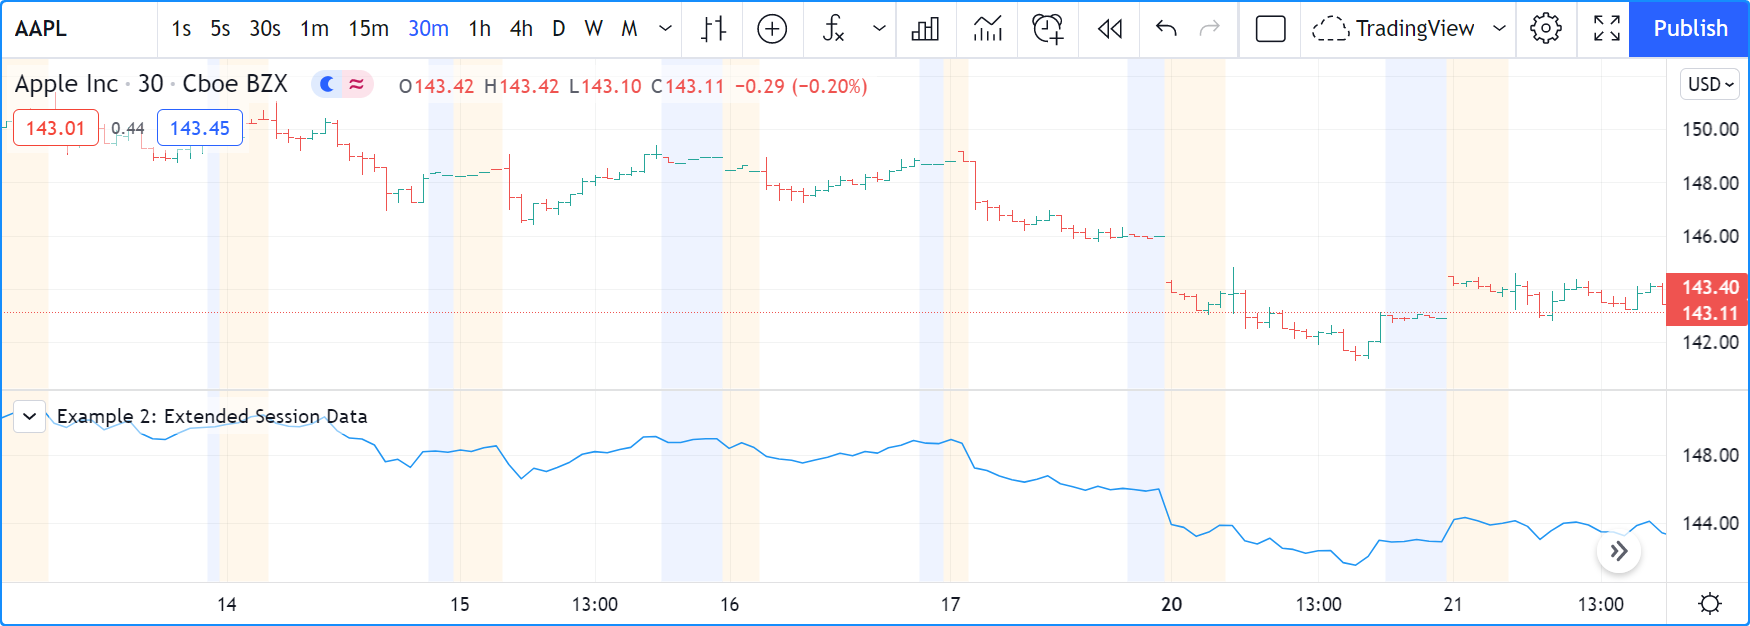
//@version=5
indicator("Example 2: Extended Session Data")
t = ticker.new("NASDAQ", "AAPL", session.extended)
extendedSessionData = request.security(t, timeframe.period, close, barmerge.gaps_on)
plot(extendedSessionData, style = plot.style_linebr)
Note that the previous chart’s gaps in the script’s plot are now filled. Also, keep in mind that our example scripts do not produce the background coloring on the chart; it is due to the chart’s settings showing extended hours.
The ticker.new() function has the following signature:
ticker.new(prefix, ticker, session, adjustment) → simple string
Where:
prefixis the exchange prefix, e.g.,"NASDAQ"tickeris a symbol name, e.g.,"AAPL"sessioncan besession.extendedorsession.regular. Note that this is not a session string.adjustmentadjusts prices using different criteria:adjustment.none,adjustment.splits,adjustment.dividends.
Our first example could be rewritten as:
//@version=5
indicator("Example 1: Regular Session Data")
t = ticker.new("NASDAQ", "AAPL", session.regular)
regularSessionData = request.security(t, timeframe.period, close, barmerge.gaps_on)
plot(regularSessionData, style = plot.style_linebr)
If you want to use the same session specifications used for the chart’s main symbol, omit the third argument in ticker.new(); it is optional. If you want your code to declare your intention explicitly, use the syminfo.session built-in variable. It holds the session type of the chart’s main symbol:
//@version=5
indicator("Example 1: Regular Session Data")
t = ticker.new("NASDAQ", "AAPL", syminfo.session)
regularSessionData = request.security(t, timeframe.period, close, barmerge.gaps_on)
plot(regularSessionData, style = plot.style_linebr)