Indicadores, Estratégias e Bibliotecas
" Volume Precedes Price is the conceptual idea for the oscillator." "The main idea of the VZO was to try to change the OBV to look like an oscillator rather than an indicator, also to include time; primarily to identify which zone the volume is located in during a specific period " How to read this indicator: Positive reading -> bullish Negative reading...
Allows User To See Next Session. Contains all 5 Forex Sessions: New York, London, Frankfurt, Asia (Tokyo), Sydney Warning! A little buggy on smaller time frames like the 5 minute. 15 minute seems to work fine!
This tool highlights where gaps happens and outlines in the chart where the gap zones are. If there is a gap up there is a green line, a gap down it is red. The gap zone is highlighted in blue. You can choose the size of your gap with the input menu to the desired size. Feel free to ask comment below. Made for the Gold Minds group
This indicator is basically just a back-testing tool. All it does is highlight the background of your charts with the specified color within the specified timezone. This is useful particularly for back-testing purposes, such as testing a day-trading strategy within a particular period of the day or ignoring signals that fall within the given timeframe (which is...
This is a dynamic structure indicator designed to map potential support and resistance zones (in all markets). It does this by looking back x amount of candles to identify major swing highs and lows on the specified reference timeframe, and then it draws a zone between the highest/lowest wick and the highest/lowest candle close across the chart until a new zone...
Indicator based on marginal zones (according to Mityukov Sergey). In open source. Formula for calculating the margin: Margin size / cost tick * minimum price change Example: EURUSD = 2100 $ / 6.25 $ * 0.00005 points = 0.01680 points .... For currency pairs where USD is in the first place it is necessary to write so that the indicator is taken away from zero Iff...
Support & Resistance Level and Supply & Demand Zone are very common and popular jargon in technical analysis. What is the difference between Support & Resistance Level and Supply & Demand Zone? In my opinion, Support & Resistance Level is the value of price that tested couple times and hard to break. The zone is formed by two adjacent levels where price may...
Regular script to allocate the specified time range within a day. TradingView in time is specified by UTC. I Moscow time (GMT +3) and the time specified in the script Default 1:00 - 13:00 Moscow time equal 09:00 - 21:00 ie -8 Hours from the Moscow time (-7 in summer). ========== ========== Обычный скрипт для выделения указанного диапазона времени внутри...
Support and Resistance using donchian channels to validate tops/bottoms (note: while donchians follow price closely within look back window, this will only update new top/bottom when making new extremes in the donchian channel) combo with other systems:
The Zone is mention in New Trading Dimensions by Bill Williams,PhD. The Zone is used for Entry Signal Green Zone are painting Green Bars when Awesome Oscillator (AO) and Accelerater/Decelerator (AC) are both increasing. Red Zone are painting Red Bars when Awesome Oscillator (AO) and Accelerater/Decelerator (AC) are both decreasing. Gray Zone are painting Gray...
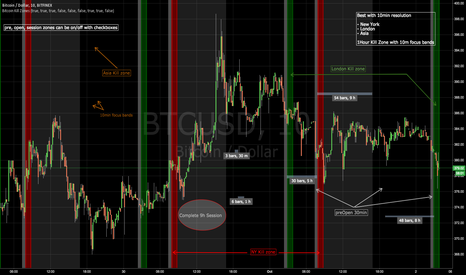
GRAB THE LASTEST VERSION HERE: ********************* This indicator shows when the candle is entering New York, London or Asia Kill Zone (open market). gray: 30min before market opens. red, green, orange: First 1 hour with 10min focus bands. silver: complete 30min session market until close. FIX NOTE: Set this hours for Asia to fix the 1 hour...
******* UPDATED VERSION ******* Use this one: **************************************** >> OLD STUFF, please use the UPDATED version!!! << COPY & PASTE the code and change manually hours to reflect reality regardless selected TimeZone: doNYOpen "1300-1310" doNYSession "1300-0000" doTokyoOpen "0030-0040" doTokyoSession "0030-0930" doLondonOpen...
Bill Williams Zone and Squat Bars. See New Trading Dimensions by Bill Williams, PhD. Bars are green (green zone) when the Awesome Oscillator and Accelerator/Decelerator are both positive. Bars are red (red zone) when the Awesome Oscillator and Accelerator/Decelerator are both negative. Bars are blue when a squat bar is formed, these indicate a battle between...
Bill Williams Zone and Squat Bars. See New Trading Dimensions by Bill Williams, PhD. Bars are green (green zone) when the Awesome Oscillator and Accelerator/Decelerator are both positive. Bars are red (red zone) when the Awesome Oscillator and Accelerator/Decelerator are both negative. Bars are blue when a squat bar is formed, these indicate a battle between...
Bill Williams Zone and Squat Bars. See New Trading Dimensions by Bill Williams, PhD. Bars are green (green zone) when the Awesome Oscillator and Accelerater/Decelerator are both positive. Bars are red (red zone) when the Awesome Oscillator and Accelerater/Decelerator are both negative. Bars are blue when a squat bar is formed, these indicate a battle between...
![Volume Zone Oscillator and Price Zone (VZO/PZO) [NeoButane] FB: Volume Zone Oscillator and Price Zone (VZO/PZO) [NeoButane]](https://s3.tradingview.com/y/YFUS4pfN_mid.png)


![[RS]Support and Resistance V0 EURUSD: [RS]Support and Resistance V0](https://s3.tradingview.com/j/JWdq2Bni_mid.png)


