Indicadores, Estratégias e Bibliotecas
The adaptive price zone (APZ) is a volatility-based technical indicator that helps investors identify possible market turning points, which can be especially useful in a sideways-moving market. It was created by technical analyst Lee Leibfarth in the article “Identify the Turning Point: Trading With An Adaptive Price Zone,” which appeared in the September...
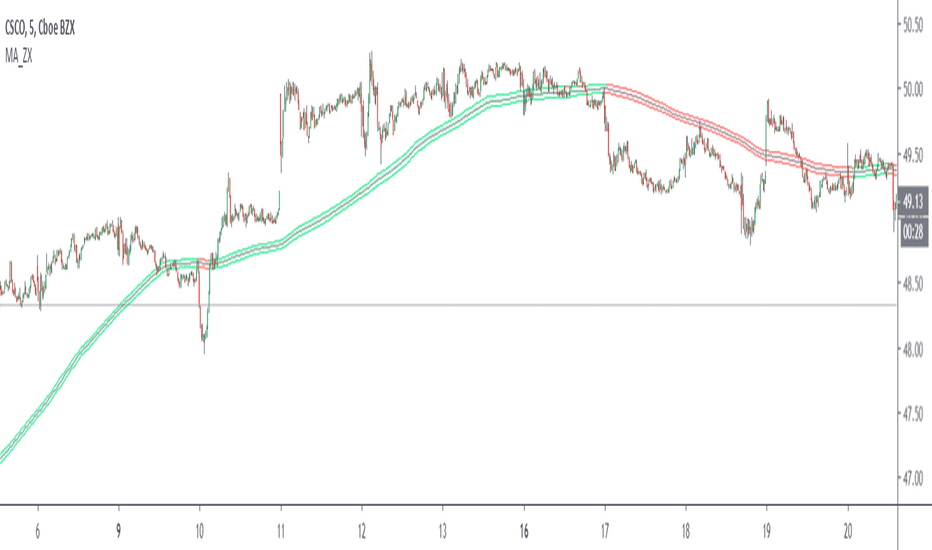
This indicator generates a zone for a moving average by means of the high and low source of the same average, the moving average should be worked as zones not as a line, by default a simple average of 200 periods is configured, the indicator has direction detection and represents it by the green and red colors, it also has padding with the same characteristic, it...
Rolling version of the MMDVZ script . The bands do not reset at a fixed interval in this version and are instead bar based. Volatility adjusted moving multi-day VWAP zones Directionality, trend and support/resistance levels at a glance Useful for trading practically all kinds of stocks and futures . Works well with many timeframes. More updates to come, stay tuned
Volatility adjusted moving multi-day VWAP zones Directionality, trend and support/resistance levels at a glance Useful for trading practically all kinds of stocks and futures. Works well with many timeframes. More updates to come, stay tuned
Green = Bullish Red = Bearish Yellow = Choppy
Extended Stochastic with All Zones. From Neutral to Danger Zones. The Most Complete and Extended Stochastic Indicator.
Extended Stochastic with All Zones. From Neutral to Danger Zones. The Most Complete and Extended Stochastic Indicator.
This indicator allows you to specify price zones in which to detect basic candlestick patterns. In the example above, I have specified the most immediate support and resistance zones on GBP/USD and set the script to detect engulfing candles. If a bearish engulfing candle occurs within the resistance zone a signal will be generated; likewise for bullish engulfing...
This indicator is a continuation of the indicator MUST READ this indicator 🚥 SMART4TRADER ATR STANDARD DEVIATION The indicator is in the main window and shows the levels at which in most cases the price is braking. The concept of this indicator is a modified ATR with a standard deviation in the smaller direction in order to determine the often recurring price...
This simple script draws the previous higher timeframe candle high/low to your chart. You can also make the script paint the zone between the low/open and the high/close.
Copy Pasta from Investopedia Interpretation The VZO points to a positive trend when it rises above and maintains the 5% level, and a negative trend when it falls below the 5% level and fails to turn higher. Oscillations between the 5% and 40% levels mark a bullish trend zone, while oscillations between -40% and 5% mark a bearish trend zone. Meanwhile, readings...
A script that draws supply and demand zones based on the RSI indicator. For example if RSI is under 30 a supply zone is drawn on the chart and extended for as long as there isn't a new crossunder 30. Same goes for above 70. The threshold which by default is set to 30, which means 30 is added to 0 and subtracted from 100 to give us the classic 30/70 threshold on...
This script allows you to set breakout alerts. An alert will be triggered only when price breaks and closes beyond the specified prices. You will get an alert on the first candle that closes beyond the levels you set.
I've created an indicator that : - Displays the previous day's, week's, month's open on the current period's price action. - Displays a vertical bar at the daily open. (The first 30-60 minutes from the daily open is commonly where the high/low of the day is made) - Displays London/NY opens as vertical bars (london close is an option, but I have disabled it by...
CDC Action Zone alert with ATR to filter low volatility period
This simple indicator paints the zone between up to 3 different Moving Averages and Exponential Moving Averages. For example: The green zone is the price between the 50 EMA and the 50 MA . The orange zone is the price between the 100 EMA and the 100 MA . The red zone is the price between the 200 EMA and the 200 MA .
This indicator paints the background of the chart between 2 EMAs when all 3 given EMAs are in sync. The default settings are: Long-term EMA: 200 Period. Short-term EMA 1: 50 Period. Short-term EMA 2: 20 Period. So according to the default settings, when the 20EMA is above the 50EMA, and the 50EMA is above the 200EMA, the area between the 20EMA and the...


