Indicadores, Estratégias e Bibliotecas
This indicator shows three types of support and resistance lines: Horizontal, Parallel (using linear regression) and Fibonacci Retracement. Lines can be adjusted or turned on and off in settings. A great tool for setting up entries, exits and locating pivot points.
This indicator displays Pivot Points & Fib Levels based on the timeframe you select. ----- There are 3-levels of support/resistance to the Pivot Points. ----- Currently there are only Fib-Levels based on the 1st Pivot Levels . Fibs will be added to the other 2 levels in the near future. The Golden Ratio is highlighted by default. ----- The Pivot...
0.65 -0.666 Fib levels or commonly know as the CC pocket Marks Strong Support/Ressitance, Use with conflunce. Lookback Length is adjustable Let me know any suggestions or ideas which could help improve
Hello All, Today I am here with a new idea and script, " LTB Zigzag Circles ". The idea is to create Circles using last 2 zigzag waves and to catch the breakouts earlier than horizontal lines. if a circle is broken then the script shows entry for Long/Short positions. and if broken circle reappears again then the position is closed. You can change Zigzag period...
Aᴜᴛᴏ PɪᴛᴄʜFᴀɴ, Fɪʙ Exᴛᴇɴꜱɪᴏɴ/Rᴇᴛʀᴀᴄᴇᴍᴇɴᴛ ᴀɴᴅ ZɪɢZᴀɢ This study aim to automate PitchFan drawing tool and combines it with Fibonacci Extentions/Retracements and ZigZag. Common setting options, applied to all components of the study Deviation , is a multiplier that affects how much the price should deviate from the previous pivot in order for the bar to...
Fɪʙᴏɴᴀᴄᴄɪ Exᴛᴇɴᴛɪᴏɴ / Rᴇᴛʀᴀᴄᴍᴇɴᴛ / Pɪᴠᴏᴛ Pᴏɪɴᴛꜱ This study combines various Fibonacci concepts into one, and some basic volume and volatility indications █ Pɪᴠᴏᴛ Pᴏɪɴᴛꜱ — is a technical indicator that is used to determine the levels at which price may face support or resistance. The Pivot Points indicator consists of a pivot point (PP) level and several...
The Fibonacci Channel is a technical analysis tool that is used to estimate support and resistance levels based on the Fibonacci numbers. It is a variation of the Fibonacci retracement tool, except with the channel the lines run diagonally rather than horizontally. This study will automatically place the channels where the levels indicate future areas of...
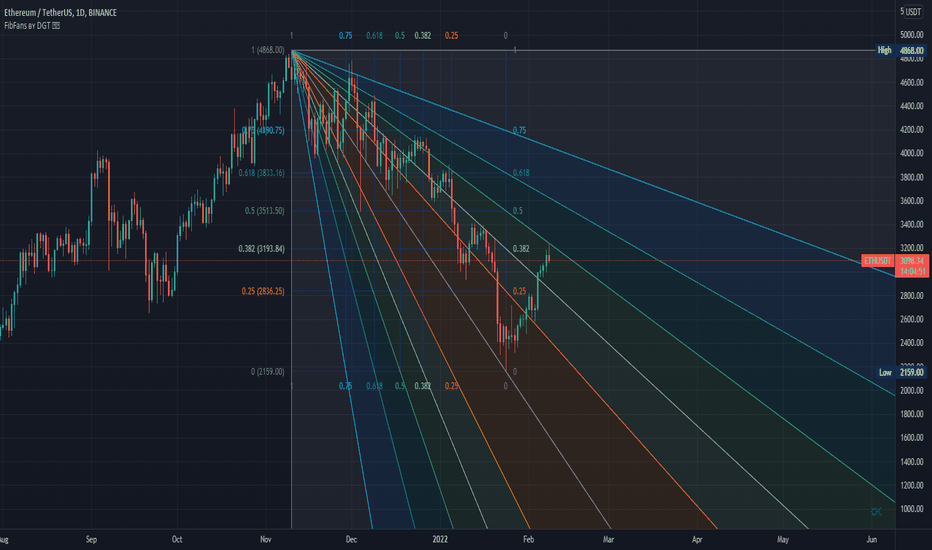
Fibonacci Speed and Resistance Fan is an analytical drawing tool used to indicate the support and resistance levels of an existing trend and the price level at which possible changes in the trend may occur. A Fibonacci Speed Resistance Fan consists of a trend line drawn between two extreme points - a trough and opposing peak or a peak and opposing trough - on...
This script is another Fibonacci script however this script gives select signals indicating when a resistance level is hit aswell as a support level. A resistance level is calculated by price action failing to close or open above a fib level yet its high crossing the level. This essentially means price action was too weak to break this level. The same goes for...
A combination of Fibonacci indicators including: 1- Moving Auto-calculated Fibo Retracement Levels 2- Dynamic Auto-calculated Fibo Extension Levels 3- Adjustable Auto-calculated Fibo Time Zones 4- ّFlexible Fibo Moving Averages Ribbon The ribbon consists of 10 moving averages of selected source for different Fibonacci numbers count of bars which could be...
This is a simpler alternative to the auto-fibonacci indicators. Calculates the fibonacci levels based on the all-time high and all-time low prices. Candles are then colored based on the current closing price's relation to the 5 levels.
This indicator is a modified version of TradingView builtin "Auto Fib Retracement". It improves how the price is displayed with exact number instead of rounded number.
Hello Traders, This is ZigZag Multi Time Frame with Fibonacci Retracement script. It calculates the ZigZag using Higher Time Frame, draw Fibonacci Retracement lines and put labels accordingly. I already published Zigzag with Fibonacci Levels script but this one is Multi Time Frame and I didn't want to change/update it. You can set ZigZag Period and Resolution...
Beacon uses the current volatility of the market based on your trading time frame to determine support and resistance levels, whether a trend is intact or ready to revert back in the range. One of the most difficult things I went through as a trader was determining whether we are in a trend day or if we are in grind up or grind down mode. I created Beacon to...
Hello Traders, Here Tweezers and Kangaroo Tail script is in your service. The script searches for Tweezer / Kangaroo Tail candlestick patterns and shows them as T (Tweezer) and K (Kangaroo Tail). Thanks to RorschachT who game me the idea and some details while working on this script. What are these candlestick patterns? Tweezers : - A tweezers...
It draws Fib retracements based on the highest high measured when HeikinAshi candles are green, and lows based on when HeikinAshi candles are red. The idea is that you can see the fib retracements based on HeikinAshi trends on a larger timeframe to help trade in smaller timeframes. for v2 I reset the fib trace when a new high is set and also at the second green...
Hello Traders, Here is my new year gift for the community, Digergence for Many Indicators v4 . I tried to make it modular and readable as much as I can. Thanks to Pine Team for improving Pine Platform all the time! How it works? - On each candle it checks divergences between current and any of last 16 Pivot Points for the indicators. - it search divergence...
Greetings Traders! I have decided to release a few scripts as open-source as I'm sure others can benefit from them and perhaps make them better.(Be sure to check my Profile for the other scripts as well: www.tradingview.com). This one is called User-Inputed Time Range & Fibs. The idea behind this script is to record the Range Highs and Lows of a User Defined...


