Implement metainfo
This article is part of a tutorial about creating a custom indicator. We recommend that you follow the guide from the start.
CustomIndicator has the required metainfo field that you will specify at this part of the tutorial.
To do this, create a StudyMetaInfo object that contains indicator metadata and assign this object to metainfo.
For a thorough understanding of the StudyMetaInfo implementation, consider the Metainfo article.
1. Specify service information
Add service information required for any custom indicator. The code sample below specifies the
_metainfoVersion and id properties.
metainfo: {
    _metainfoVersion: 53,
    id: "Custom Moving Average@tv-basicstudies-1",
    // ...
}
2. Specify indicator name
Specify the indicator name that will be displayed in the Indicators dialog and the Legend. To do this, use the description and shortDescription properties, respectively.
metainfo: {
    // ...
    description: "Custom Moving Average", // Name in the Indicators dialog
    shortDescription: "Custom MA",        // Name in the Legend
}
3. Position on the chart
Custom Moving Average should be displayed on the same pane with the source symbol and remain attached to this symbol.
Therefore, you should configure the is_price_study and linkedToSeries properties as follows:
metainfo: {
    // ...
    is_price_study: true, // Display on the same pane with symbol
    linkedToSeries: true, // Attach indicator to the symbol
}
If an indicator is attached to the symbol, users cannot move the symbol to another pane without the indicator.
4. Specify visual representation
Each indicator is represented with visual elements such as plots, bands (horizontal lines), and filled (color) areas. In this tutorial, the Custom Moving Average indicator will be represented with two plots. To implement the plots and specify their appearance, adjust the properties below.
plots
Define two plots in plots as follows:
metainfo: {
    // ...
    plots: [
        { id: "plot_0", type: "line" },      // Simple Moving Average
        { id: "smoothedMA", type: "line" },  // Smoothing Line
    ],
}
The plots property contains two StudyLinePlotInfo objects with the following parameters:
idthat is used to refer to the plottypethat specifies the plot form
styles
Next, use the styles property to specify appearance settings for each plot defined in plots.
The styles property should contain a MappedObject. In this object, key is a certain plot's id, and
TValue is a StudyStylesInfo object.
In StudyStylesInfo, specify basic appearance settings that are initialized once and cannot be changed by users, for example, the plot's name in the Styles tab.
Note that users can change a line type in the UI, for example, from Line to Histogram. Therefore, you should specify StudyStylesInfo properties related to other line types if necessary.
metainfo: {
    // ...
    styles: {
        plot_0: {
            title: "Plot",     // Name in the Styles tab
            histogramBase: 0,  // Histogram base level
            joinPoints: false  // Whether join points when the plot type is `Circles` or `Cross`
        },
        smoothedMA: {
            title: "Smoothed MA",
            histogramBase: 0,
            joinPoints: false,
        },
    },
}
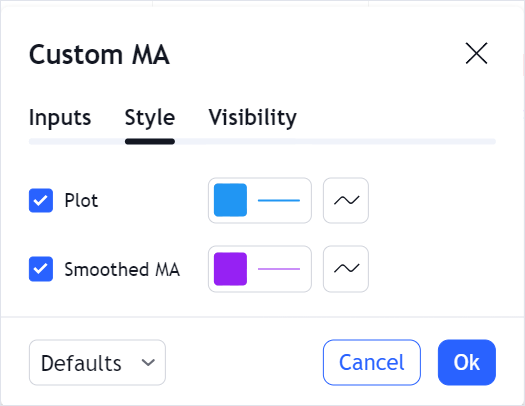
Style defaults
All default indicator settings should be stored in a StudyDefaults object. You should assign this object to defaults.
To provide default appearance settings for each plot defined in plots, use the styles property within StudyDefaults.
This property should contain a MappedObject. In this object, key is a certain plot's id, and TValue is a StudyLinePlotPreferences object. In StudyLinePlotPreferences, specify default appearance settings, for example, a line color and width.
metainfo: {
    // ...
    defaults: {
        styles: {
            plot_0: {
                linestyle: 0,       // LineStyle.Solid
                linewidth: 1,
                plottype: 0,        // LineStudyPlotStyle.Line
                trackPrice: false,  // Hide the price line
                transparency: 0,
                visible: true,
                color: "#2196F3",
            },
            smoothedMA: {
                linestyle: 0,
                linewidth: 1,
                plottype: 0,
                trackPrice: false,
                transparency: 0,
                visible: true,
                color: "#9621F3",
            },
        },
    },
}
Users can change these appearance settings in the Styles tab.
5. Specify data
Next, you should specify data that the indicator uses.
Data format
Depending on the indicator data, the Price Scale displays price, volume, or percent values. You can specify the indicator's data type using the format property.
In this tutorial, Custom Moving Average has the same format as the source symbol. Therefore, format is set to inherit.
metainfo: {
    // ...
    format: { type: "inherit" },
}
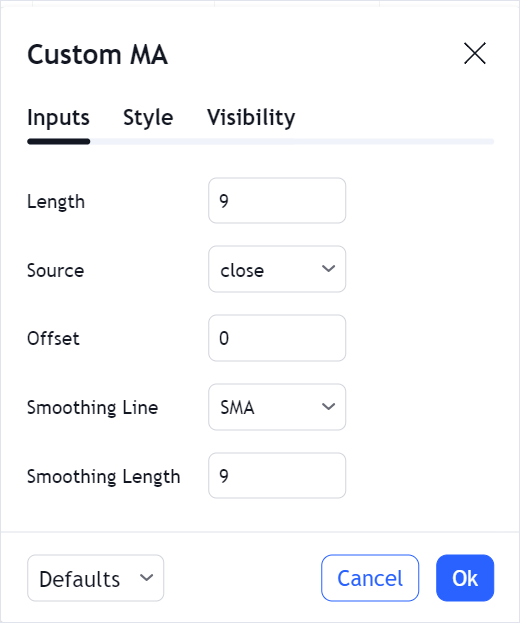
inputs
You can allow users to adjust some indicator parameters such as a source symbol or time period. To do this, specify input parameters that users can change in the Inputs tab. The parameter values are used in the indicator calculations.
To specify input parameters, assign an array of objects to the inputs property. Each object should implement a certain interface depending on the parameter type. The table below contains the Custom Moving Average input parameters and the corresponding interfaces.
| Input parameter | Interface | Description |
|---|---|---|
| Length | StudyNumericInputInfo | A time period that is used in calculating the SMA. |
| Source | StudySourceInputInfo | Bar values that are used in calculating the SMA. |
| Offset | StudyNumericInputInfo | A number of bars to shift to the right or left. |
| Smoothing Line | StudyTextInputInfo | A type of the Smoothing Line. Possible types are: SMA, EMA, and WMA. |
| Smoothing Length | StudyNumericInputInfo | A length of the Smoothing Line. |
All these interfaces have the following properties:
idthat is used to refer to the input parameternamethat specifies the parameter name in the Inputs tabtypethat specifies the parameter data typedefvalthat specifies the default parameter value
Other properties depend on the parameter type.
Implement the input parameters as follows:
metainfo: {
    // ...
    inputs: [
        {
            id: "length",
            name: "Length",   // Parameter name in the Inputs tab
            defval: 9,        // 9 bars
            type: "integer",
            min: 1,
            max: 10000,
        },
        {
            id: "source",
            name: "Source",
            defval: "close",  // Close price
            type: "source",
            options: [        // Options in the drop-down menu
                "open",
                "high",
                "low",
                "close",
                "hl2",
                "hlc3",
                "ohlc4",
            ],
        },
        {
            id: "offset",
            name: "Offset",
            defval: 0,
            type: "integer",
            min: -10000,
            max: 10000,
        },
        {
            id: "smoothingLine",
            name: "Smoothing Line",
            defval: "SMA",
            type: "text",
            options: ["SMA", "EMA", "WMA"],
        },
        {
            id: "smoothingLength",
            name: "Smoothing Length",
            defval: 9,
            type: "integer",
            min: 1,
            max: 10000,
        },
    ],
}
Input defaults
In Style defaults, you have created the StudyDefaults object and assigned it to defaults.
To provide default values for each input parameter defined in inputs, use the inputs property within StudyDefaults.
This property should contain the id properties of all input parameters and the corresponding default values.
metainfo: {
    // ...
    defaults: {
        styles: {
            // ...
        },
        inputs: {
            length: 9,
            source: "close",
            offset: 0,
            smoothingLine: "SMA",
            smoothingLength: 9,
        },
    },
}
Complete code
At this stage, you have implemented the StudyMetaInfo object and assigned it to the metainfo field.
Expand to view the complete code for the StudyMetaInfo object.
StudyMetaInfo object.var widget = window.tvWidget = new TradingView.widget({
// ...
custom_indicators_getter: function(PineJS) {
return Promise.resolve([
// Indicator object
{
name: 'Custom Moving Average',
metainfo: {
_metainfoVersion: 53,
id: "Custom Moving Average@tv-basicstudies-1",
description: "Custom Moving Average",
shortDescription: "Custom MA",
format: { type: "inherit" },
linkedToSeries: true,
is_price_study: true,
plots: [
{ id: "plot_0", type: "line" },
{ id: "smoothedMA", type: "line" },
],
defaults: {
styles: {
plot_0: {
linestyle: 0,
linewidth: 1,
plottype: 0,
trackPrice: false,
transparency: 0,
visible: true,
color: "#2196F3",
},
smoothedMA: {
linestyle: 0,
linewidth: 1,
plottype: 0,
trackPrice: false,
transparency: 0,
visible: true,
color: "#9621F3",
},
},
inputs: {
length: 9,
source: "close",
offset: 0,
smoothingLine: "SMA",
smoothingLength: 9,
},
},
styles: {
plot_0: { title: "Plot", histogramBase: 0, joinPoints: true },
smoothedMA: {
title: "Smoothed MA",
histogramBase: 0,
joinPoints: false,
},
},
inputs: [
{
id: "length",
name: "Length",
defval: 9,
type: "integer",
min: 1,
max: 10000,
},
{
id: "source",
name: "Source",
defval: "close",
type: "source",
options: [
"open",
"high",
"low",
"close",
"hl2",
"hlc3",
"ohlc4",
],
},
{
id: "offset",
name: "Offset",
defval: 0,
type: "integer",
min: -10000,
max: 10000,
},
{
id: "smoothingLine",
name: "Smoothing Line",
defval: "SMA",
type: "text",
options: ["SMA", "EMA", "WMA"],
},
{
id: "smoothingLength",
name: "Smoothing Length",
defval: 9,
type: "integer",
min: 1,
max: 10000,
},
],
},
constructor: function() {
// ...
}
}
]);
},
});
Next, you will specify the constructor field.