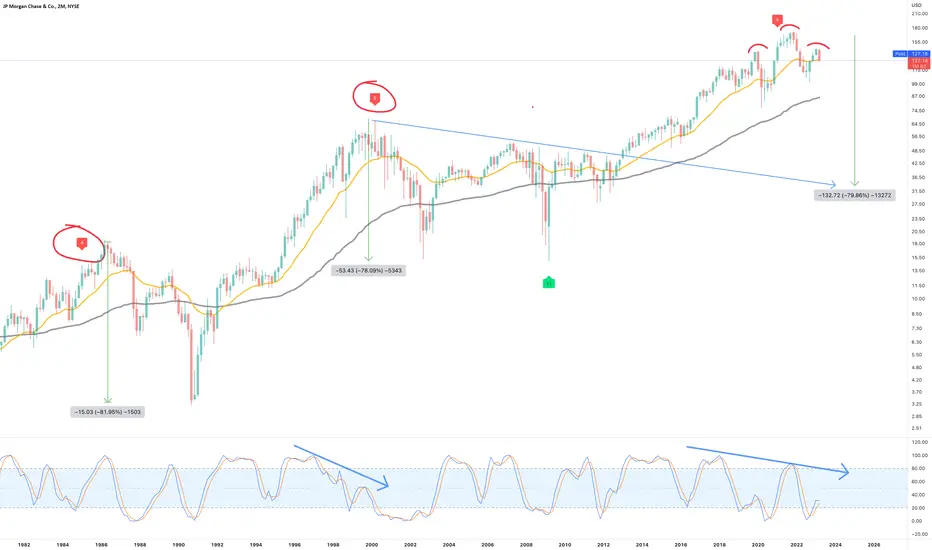
A safe pair of hands. That’s what they tell me about JP Morgan. The chart says otherwise.
On the above 2-month chart a significant negative divergence has confirmed with price action. Looking left history tells us a correction of up to 80% follows with those powerful divergencies. A strong sell signal also printed on the chart similar to that in 1999 (not shown on chart).
Is it possible price action continues rising? Sure.
Is it probable? No.
Shall continue to study banks around the world to determine if this is a global issue or restricted to the USA. Indications at this time suggest the stress is restricted to American, Australia, & Swiss banks, I don’t know why. Remaining European banks do not appears to show the same bearishness.
Ww
Trade ativo
To be a fly on the wall of those meetings during those forced takeovers. Don't worry, we've got leaked video..youtube.com/watch?v=QcoHpiiWc9Q
Trade ativo
Price action has now broken out of the 2nd bear flag with two candle bodies from the 2-week chart.Trade ativo
"Jamie Dimon to sell JPMorgan stock for first time"He's obviously a WW follower...
ft.com/content/8dfffd9b-3d9c-4819-a3df-9655f9888fac
2-week Gravestone DOJI
Aviso legal
As informações e publicações não devem ser e não constituem conselhos ou recomendações financeiras, de investimento, de negociação ou de qualquer outro tipo, fornecidas ou endossadas pela TradingView. Leia mais em Termos de uso.
Aviso legal
As informações e publicações não devem ser e não constituem conselhos ou recomendações financeiras, de investimento, de negociação ou de qualquer outro tipo, fornecidas ou endossadas pela TradingView. Leia mais em Termos de uso.