(D) BTcusd inside a higher degree expanding triangle?
After a retest of the previous fractal support from September 21, we have the most recent support forged at 39558.
Based on the recent price behavior and the Fibonacci ratios presented, I assume that a clear violation of the fractal support could trigger more downside momentum for bitcoin.
Price action:
A head and shoulders formation will only validate with a violation of the support. We have targets for the pattern projected at 13684, anticipating a huge drop that could be as deep as -67% from the current price.
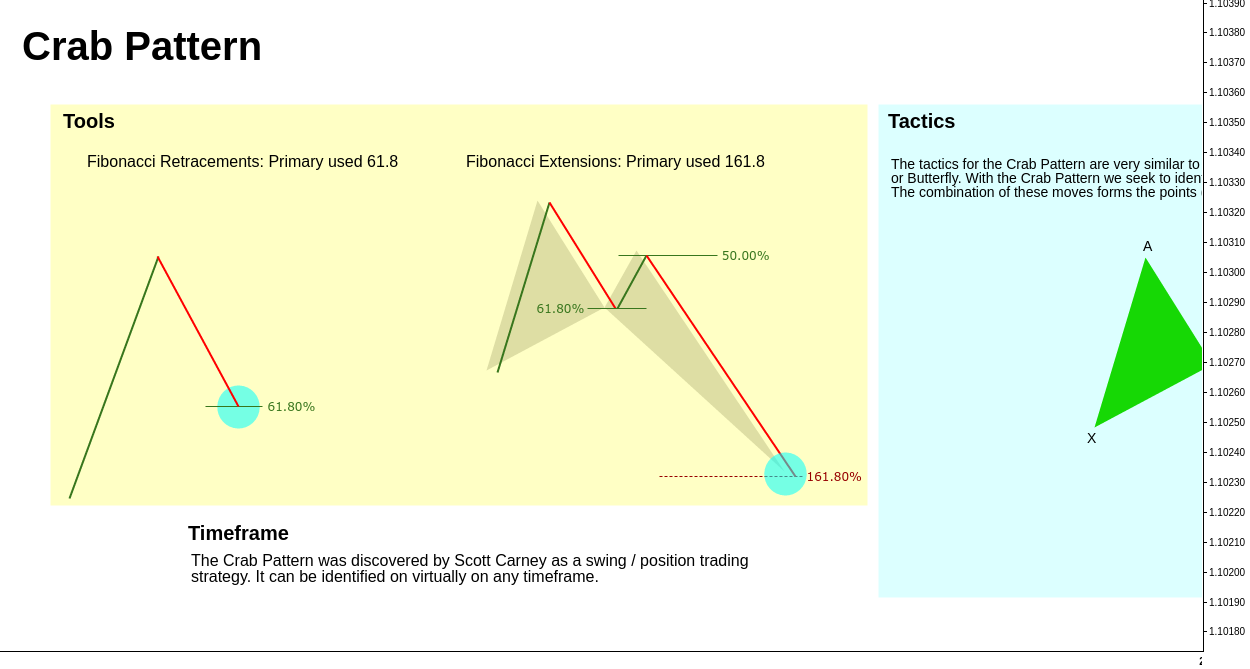
Fibonacci:
The previous lows from December 4 forged at 41967 could help define the next pattern to form below support, of course, assuming the violation of it.
We have a symmetrical projection at 25k (where AB equals CD), and the bullish crab pattern projected just a few points below at 21469 - the golden 161.8% fib extension - forming kind of a cluster between both patterns completion points.
Both patterns can help reinforce a descending trend line support, forming what appears to be a higher degree expanding triangle.
How to trade the pattern:
important:
Making it clear that the same chart can be subject to different interpretations, and that an opposite mindset can also seem/ or /be rational. This is just one of the possible scenarios, taking into account the most recent ratios and variables, and these may be subject to some adjustments, depending on future developments.
That said, the trade suggestion is a put option below support.
The fractal is currently being used as a neck for the head and shoulders formation, we should wait for a period of consolidation below support, expected to be short-lived, and after confirmation, we should aim for the previous lows of June 2021 forged at 28600 in a first phase, taking the opportunity to adjust our stops to breakeven, if/once reached.
A second target should be placed in the default target zone, close to 13684, without taking your eye off the golden fib projected at 21470 - the completion point of the bullish crab pattern - which can give rise to an attempt to bounce after its formation.


Comentário:

Comentário: